Published on 2025-06-26T05:28:21Z
What is Survey Analytics? Importance and Examples
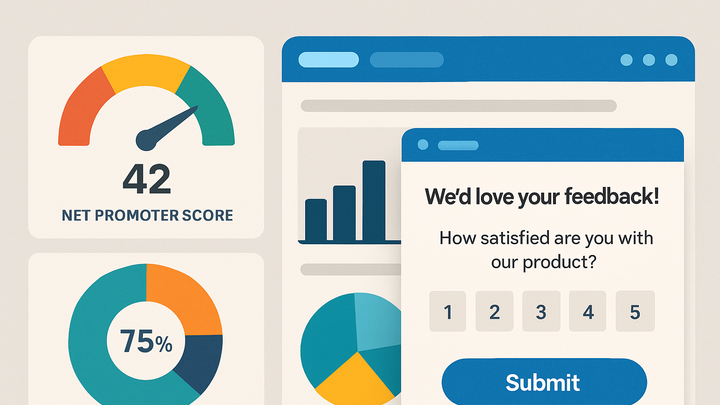
Survey Analytics refers to the practice of collecting, processing, and interpreting data gathered from user surveys to uncover actionable insights. Within the analytics industry, it bridges quantitative analytics with direct user feedback, offering a rich understanding of customer sentiment, satisfaction, and behavior. By integrating survey responses with behavioral data from tools like Google Analytics 4 (GA4) or plainSignal, organizations can correlate what users say with what they do on a website or app. Key metrics such as response rate, Net Promoter Score (NPS), and satisfaction ratings are commonly analyzed to guide product improvements, marketing strategies, and customer experience enhancements. Implementing Survey Analytics involves embedding survey widgets or pop-ups, tracking survey events through analytics platforms, and visualizing results in dashboards. This approach empowers teams to make data-driven decisions grounded in user opinions, leading to more customer-centric products and services.
Survey analytics
Collecting and analyzing survey responses to understand user sentiment, measure satisfaction, and inform data-driven decisions.
Introduction to Survey Analytics
Survey Analytics combines quantitative analytics with direct user feedback to provide a comprehensive view of customer experience. It involves deploying surveys within digital experiences, capturing responses, and analyzing the data alongside behavioral metrics. This section outlines the fundamental concepts and why Survey Analytics is a valuable extension of traditional web analytics.
-
Definition
Survey Analytics is the process of collecting, analyzing, and interpreting survey responses from users to extract actionable insights.
-
Purpose
It allows organizations to measure customer sentiment, gather feedback on specific features, and identify areas for improvement.
Key Metrics and Components
To derive meaningful insights from Survey Analytics, focus on essential metrics that quantify response quality and user satisfaction. Combining these metrics with other analytics data can reveal deeper patterns in user behavior and sentiment.
-
Response rate
The percentage of users who complete the survey out of all those presented with it. Higher rates indicate better engagement.
-
Net promoter score (nps)
A metric that measures user loyalty by asking respondents how likely they are to recommend a product on a 0–10 scale. NPS = %Promoters − %Detractors.
-
Satisfaction score
The average rating on satisfaction questions, typically on a scale from 1 to 5 or 1 to 7, indicating overall contentment.
-
Open-ended feedback
Qualitative insights from free-text responses, analyzed for sentiment, themes, and suggestions.
Implementing Survey Analytics with GA4 and plainSignal
This section describes how to set up and capture survey-related events using Google Analytics 4 (GA4) and plainSignal for cookieless analytics, including code examples.
-
GA4 implementation
In Google Analytics 4, capture survey interactions by sending custom events such as
survey_promptandsurvey_completed, along with relevant parameters.-
Event naming
Use consistent event names like
survey_promptandsurvey_submitto track the survey life cycle. -
Parameter mapping
Include parameters such as
survey_id,score, anduser_segment, then map them to GA4 custom dimensions for detailed analysis.
-
-
PlainSignal implementation
With plainSignal’s cookieless analytics, embed the script in your site and use its API to track survey events directly.
<link rel="preconnect" href="//eu.plainsignal.com/" crossorigin />
<script defer data-do="yourwebsitedomain.com" data-id="0GQV1xmtzQQ" data-api="//eu.plainsignal.com" src="//cdn.plainsignal.com/plainsignal-min.js"></script>
After installation, you can track events:
PlainSignal('track', 'survey_completed', { survey_id: 'survey123', score: 8 });-
Installation
Add the PlainSignal script tag to your HTML
<head>as shown above to initialize cookieless analytics. -
Event tracking
Use
PlainSignal('track', ...)to record survey events with custom parameters for later analysis.
-
Best Practices and Use Cases
Follow established best practices to maximize response quality and leverage survey data effectively. Explore common use cases across different business goals.
-
Optimizing survey timing
Trigger surveys at natural breakpoints (e.g., after checkout or feature use) to increase response rates without disrupting the user experience.
-
Segmentation and personalization
Use survey responses to segment users and tailor future experiences, improving relevance and satisfaction.
