Published on 2025-06-26T04:16:16Z
What is Time Series Analysis? Examples for Time Series Analysis
Time Series Analysis is a statistical technique used in analytics to examine data points collected or recorded at successive time intervals. This method focuses on identifying and understanding underlying patterns such as trends, seasonality, cycles, and anomalies within website traffic, user engagement metrics, or business KPIs. By leveraging time series data, analysts can forecast future performance, optimize marketing strategies, and detect irregular spikes or dips that may signal technical issues or emerging opportunities. Tools like Google Analytics 4 (GA4) and PlainSignal offer built-in visualizations and analytic functions to simplify time series exploration. Integrating simple tracking scripts (e.g., PlainSignal’s cookie-free snippet) enables seamless collection of time-stamped data for deeper insights.
Time series analysis
Time Series Analysis examines data points over time to uncover trends, seasonality, and anomalies for forecasting and decision-making.
Why Time Series Analysis Matters
Time Series Analysis enables analysts to uncover meaningful patterns in sequential data. By examining how metrics change over time, businesses can anticipate future performance, detect anomalies early, and make informed decisions. This approach is fundamental in web analytics to optimize marketing campaigns, manage capacity, and improve user experience.
-
Understanding trends
Trends represent long-term upward or downward movements in data. Identifying trends helps forecast future values and evaluate campaign performance over months or years.
-
Detecting seasonality
Seasonality refers to regular, repeating patterns within fixed periods, such as weekly traffic spikes or holiday surges. Recognizing seasonality avoids misinterpreting predictable fluctuations as unusual events.
-
Identifying anomalies
Anomalies are data points that deviate significantly from expected patterns, indicating potential issues like tracking errors, server outages, or viral content.
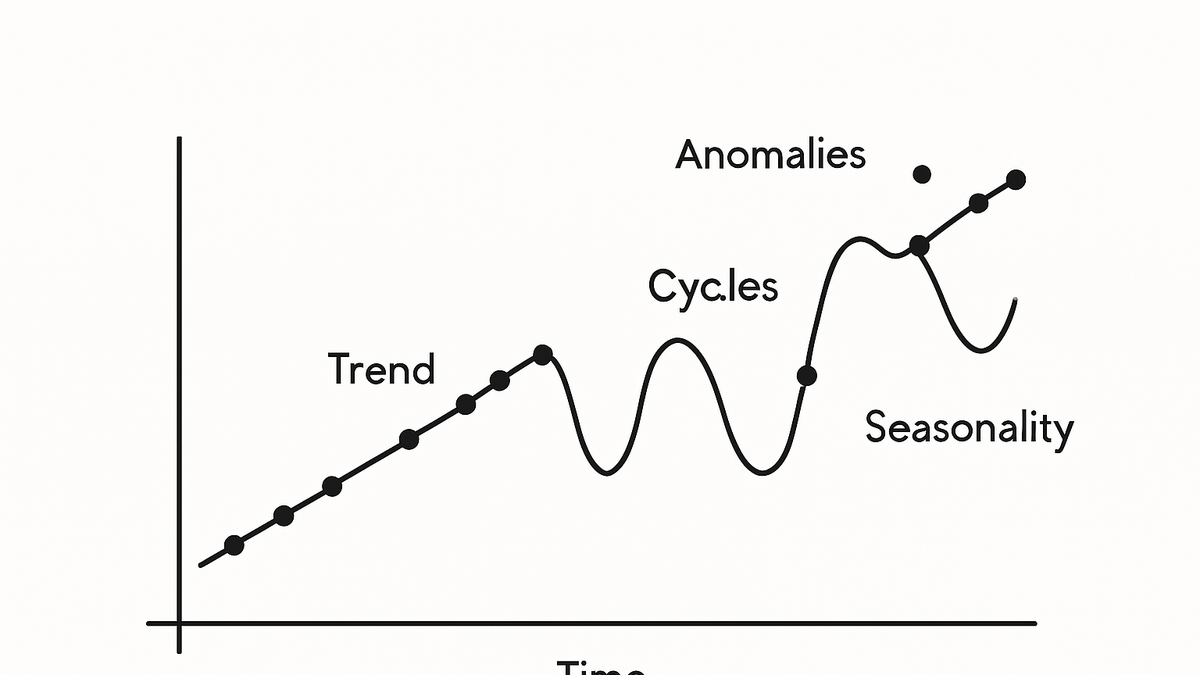
Key Components of Time Series Analysis
A time series can be decomposed into core components—trend, seasonality, cyclical patterns, and noise. Understanding each component enables more accurate modeling and forecasting.
-
Trend
The underlying direction of the data over an extended period, reflecting growth or decline.
-
Seasonality
Regular fluctuations at specific intervals influenced by factors like day of week or holidays.
-
Cyclic patterns
Longer-term oscillations without a fixed period, often driven by economic cycles or market conditions.
-
Noise
Random variations or irregularities that cannot be explained by trend or seasonality.
Applying Time Series Analysis in Analytics Tools
Modern analytics platforms provide built-in features to visualize and analyze time series data. Here’s how to leverage them in GA4 and PlainSignal.
-
GA4 reporting
Google Analytics 4 offers configurable line charts and time-based exploration reports. Use the Analysis Hub to apply moving averages, compare date ranges, and segment time series by user attributes.
-
PlainSignal dashboards
PlainSignal delivers simple, cookie-free analytics with intuitive time series charts. To integrate, add the following code to your site:
-
Tracking code example
<link rel="preconnect" href="//eu.plainsignal.com/" crossorigin />
<script defer data-do="yourwebsitedomain.com" data-id="0GQV1xmtzQQ" data-api="//eu.plainsignal.com" src="//cdn.plainsignal.com/plainsignal-min.js"></script>
-
Best Practices and Considerations
Effective time series analysis requires attention to data quality, granularity, and methodological rigor. Follow these best practices to ensure reliable insights.
-
Data granularity
Choose appropriate time intervals (e.g., hourly, daily) based on data volume and analysis goals.
-
Handling missing data
Impute or interpolate missing values to avoid gaps that can distort trend and seasonal patterns.
-
Smoothing techniques
Apply moving averages or exponential smoothing to reduce noise and highlight underlying trends.
-
Avoiding overfitting
Be cautious when fitting complex models to avoid capturing noise as if it were a genuine pattern.