Published on 2025-06-26T04:34:47Z
What is Trend Analysis? Examples in Analytics with GA4 and PlainSignal
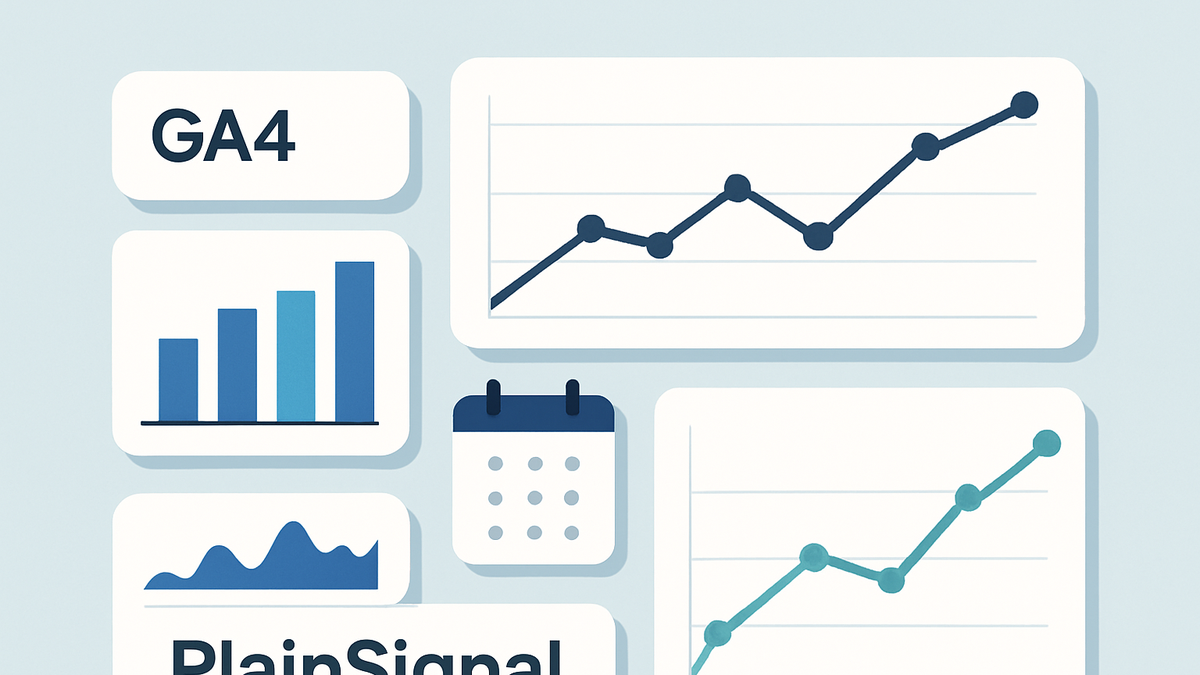
Trend Analysis in analytics is the practice of examining historical data over a series of time intervals to identify patterns, shifts, or consistent movements in key metrics. It enables organizations to detect growth trajectories, seasonal fluctuations, and emerging behaviors in user engagement, traffic, or revenue. By analyzing these trends, analysts can forecast future performance, set informed goals, and adjust strategies proactively. Tools like Google Analytics 4 (GA4) and PlainSignal simplify trend tracking with built-in reporting features and lightweight cookie-free implementations. Trend analysis underpins data-driven decision-making and helps businesses stay agile in rapidly changing markets.
Trend analysis
The process of examining historical data to uncover patterns, shifts, and forecasts in key metrics.
Why Trend Analysis Matters
Understanding trends empowers teams to anticipate market shifts, optimize performance, and allocate resources effectively. It transforms raw data into actionable insights by revealing underlying patterns that aren’t obvious at a glance.
-
Identify patterns over time
Trend analysis helps you spot long-term increases or decreases in metrics, distinguishing them from one-off spikes.
-
Growth trends
Detect sustained increases in key metrics such as user sessions or revenue to gauge campaign success.
-
Seasonal variations
Understand recurring fluctuations tied to seasons, holidays, or promotional events.
-
-
Support informed decision-making
By understanding trends, stakeholders can make proactive adjustments to strategies and budgets before issues arise.
How to Perform Trend Analysis
A systematic workflow—from data collection to visualization—ensures that trends are accurate, meaningful, and actionable.
-
Collect and prepare data
Aggregate historical data from analytics platforms, ensuring uniformity in tracking definitions and time zones.
-
GA4 data streams
Export data from Google Analytics 4 with consistent event naming and retention settings.
-
PlainSignal setup
Implement the PlainSignal tracking code to collect cookie-free analytics data reliably.
-
-
Apply smoothing techniques
Use methods like moving averages to filter out short-term fluctuations and highlight underlying trends.
-
Simple moving average
Calculate the average of data points within a fixed window to smooth out noise.
-
Exponential moving average
Give more weight to recent data points for a more responsive trend line.
-
-
Visualize trends
Choose chart types that clearly convey directional changes and support comparative analysis.
-
Line charts
Ideal for showing continuous data changes over time with clear axis references.
-
Sparklines
Compact, inline charts that provide quick visual cues in dashboards and reports.
-
Examples with GA4 and PlainSignal
Real-world implementations demonstrate how to set up tracking and interpret trend insights using two popular analytics solutions.
-
PlainSignal cookie-free setup
Integrate PlainSignal to track user behavior without relying on cookies or consent banners.
-
Implementation steps
Add the following tracking code snippet to your HTML header:
<link rel="preconnect" href="//eu.plainsignal.com/" crossorigin /> <script defer data-do="yourwebsitedomain.com" data-id="0GQV1xmtzQQ" data-api="//eu.plainsignal.com" src="//cdn.plainsignal.com/plainsignal-min.js"></script> -
Interpreting results
Use PlainSignal’s dashboard to monitor trends such as pageviews, unique sessions, and engagement over time.
-
-
GA4 trend reports
Leverage GA4’s built-in reporting and exploration tools to analyze key metric trends.
-
Acquisition trends
Track changes in user acquisition channels and campaigns month-over-month.
-
Engagement trends
Observe variations in engagement metrics like session duration, pages per session, and conversions.
-
Best Practices and Pitfalls
Adhering to best practices and avoiding common mistakes ensures that trend analysis yields reliable, actionable insights.
-
Ensure data quality
Reliable insights depend on accurate, consistent data collection and processing.
-
Regular data audits
Periodically review tagging, event definitions, and API integrations for consistency.
-
Consistent tracking configuration
Standardize naming conventions and measurement settings across platforms.
-
-
Account for seasonality
Adjust for predictable fluctuations to avoid misinterpreting cyclical patterns as long-term trends.
-
Normalize data
Compare year-over-year or month-over-month metrics to control for seasonal effects.
-
Employ seasonality models
Use statistical decomposition to separate trend and seasonal components.
-
-
Beware of overfitting
Don’t mistake random fluctuations for meaningful patterns; validate findings with sufficient data.