Published on 2025-06-26T04:37:51Z
What is ARPU? Definition & Examples in the Analytics Industry
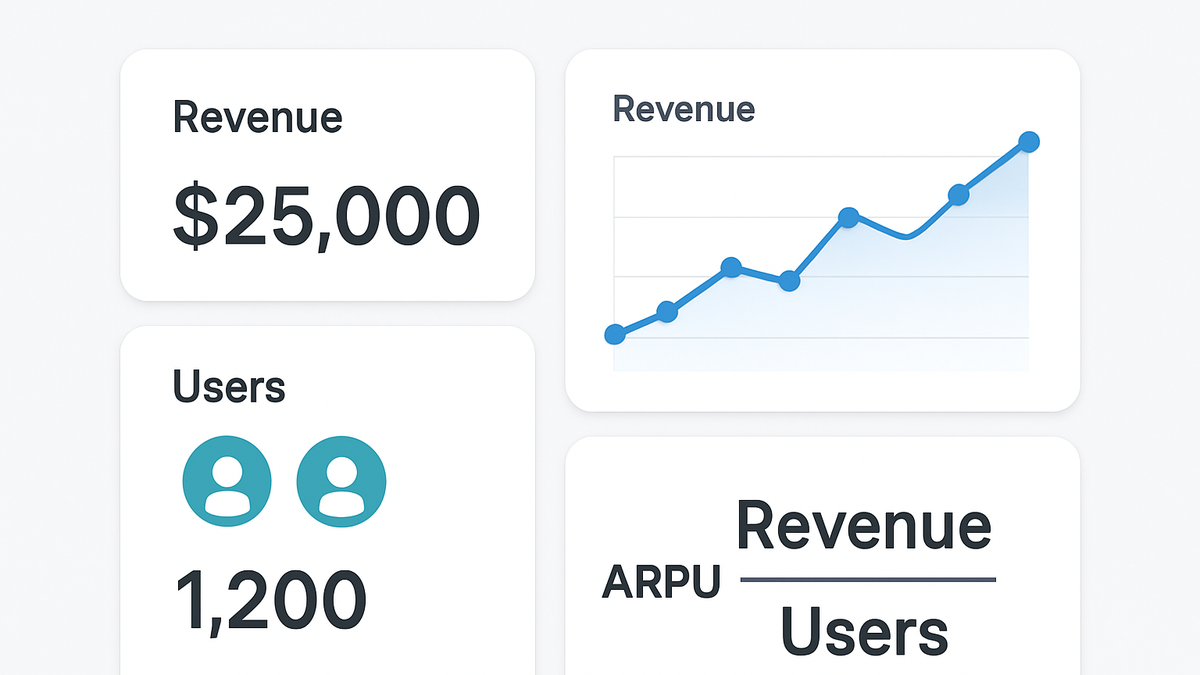
In analytics, ARPU (Average Revenue Per User) is a key performance indicator that represents the average revenue generated per user over a specified period. It is calculated by dividing total revenue by the number of unique users. ARPU helps organizations understand customer value, benchmark performance across time periods or cohorts, and guide strategic decisions related to pricing and marketing.
SaaS and digital analytics platforms like PlainSignal (a cookie-free analytics solution) and Google Analytics 4 (GA4) both support revenue tracking which can be leveraged to compute ARPU. By combining accurate revenue data with user counts, businesses gain insights into the effectiveness of monetization strategies and opportunities for growth.
In the following sections, we’ll explore the ARPU formula in detail, show how to implement tracking in PlainSignal and GA4, and discuss practical tactics to optimize ARPU for sustainable revenue growth.
Arpu
Average Revenue Per User (ARPU) measures the average revenue generated per user over a period, guiding pricing, marketing, and growth strategies.
Definition and Importance
This section explains what ARPU is, how it’s calculated, and why it matters as a key performance indicator in analytics.
-
Arpu formula
ARPU is calculated by dividing total revenue by the number of unique users during a specific period, showing average revenue per user.
-
Total revenue
The sum of all revenue generated in the given time frame, including subscriptions, transactions, and other monetization streams.
-
Number of users
The total number of distinct users or customers active in the same period.
-
-
Business significance
ARPU provides insight into customer value, allows benchmarking across periods or cohorts, and guides pricing, marketing, and product decisions.
Implementing ARPU Tracking in Analytics Tools
Learn how to set up revenue and user tracking in PlainSignal and GA4 to accurately compute ARPU in your analytics workflow.
-
Tracking with PlainSignal (cookie-free analytics)
PlainSignal can capture user data without cookies. Embed the following HTML snippet in the
<head>of your pages:<link rel='preconnect' href='//eu.plainsignal.com/' crossorigin /> <script defer data-do='yourwebsitedomain.com' data-id='0GQV1xmtzQQ' data-api='//eu.plainsignal.com' src='//cdn.plainsignal.com/plainsignal-min.js'></script>Then configure revenue events in PlainSignal to capture revenue metrics and calculate ARPU in the dashboard.
-
Calculating arpu in google analytics 4 (GA4)
In Google Analytics 4, ensure your revenue events are set up correctly and use Explorations to calculate ARPU. Add the standard gtag.js snippet and log purchase events with revenue values. Example tracking code:
<script async src='https://www.googletagmanager.com/gtag/js?id=G-XXXXXXX'></script>
<script>
  window.dataLayer = window.dataLayer || [];
  function gtag(){dataLayer.push(arguments);}
  gtag('js', new Date());
  gtag('config', 'G-XXXXXXX');
  // Log a purchase event
  gtag('event', 'purchase', { value: 100.00, currency: 'USD' });
</script>
Then in the GA4 UI, go to Explorations and divide ‘Total revenue’ by ‘Active users’ to derive ARPU.
-
E-commerce events
Configure purchase or transaction events with a revenue parameter to accurately capture revenue data.
-
User metrics
Use the Active Users metric in Explorations or reports to obtain the denominator for ARPU calculations.
-
Strategies to Improve ARPU
Explore practical tactics and best practices to increase your average revenue per user and drive sustainable growth.
-
Upselling and cross-selling
Offer premium features, add-ons, or complementary products to encourage higher per-user spending.
-
Pricing tiers and packaging
Design pricing plans that align with customer segments and usage patterns to maximize average revenue.
-
Feature adoption and engagement
Promote high-value features that drive more usage and justify higher price points.