Published on 2025-06-28T04:49:57Z
What is Attach Rate? Analytics Definition and Examples
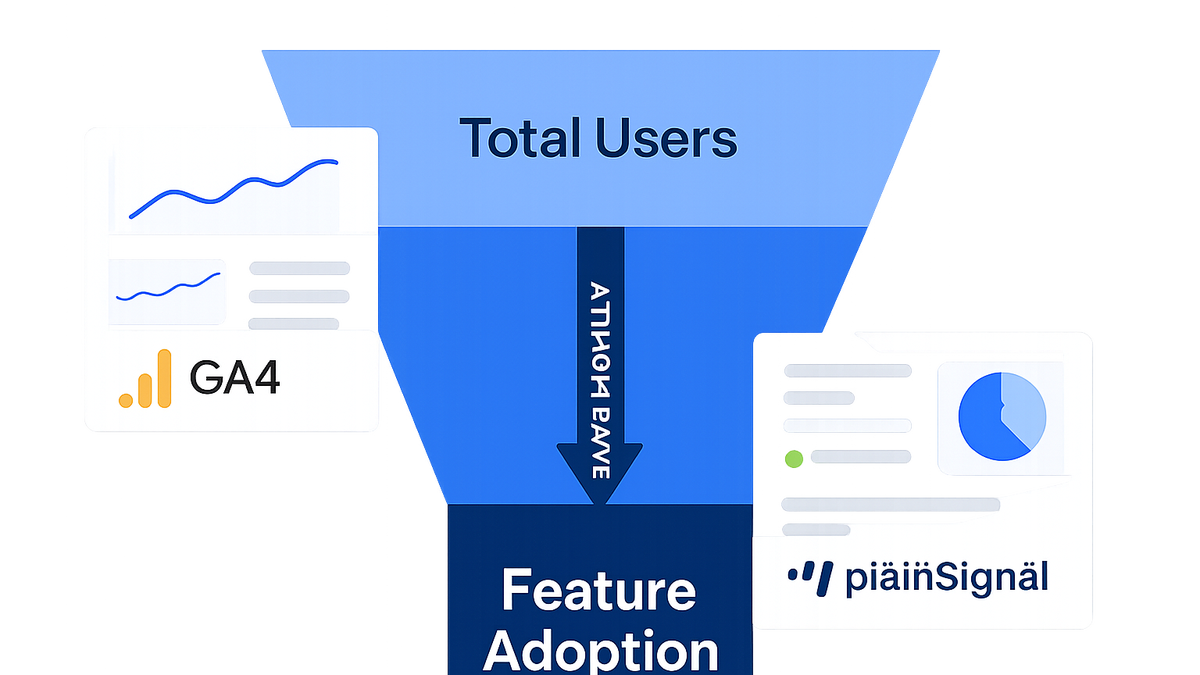
In analytics, Attach Rate measures the proportion of users who adopt or engage with an additional product, feature, or service relative to the total user base. It helps teams understand upsell, cross-sell, and feature adoption success over time. Unlike conversion rate, which tracks completion of primary goals like purchases, attach rate focuses on secondary behaviors such as enabling a paid plugin or subscribing to a premium feature. This metric is crucial for product managers and marketers aiming to drive incremental revenue from existing users. Attach rate can be calculated at both the user level and the session level, depending on the analysis context. Tools such as Google Analytics 4 (GA4) and plainSignal can be configured to track attach events and derive attach rate insights for data-driven decision making.
Attach rate
Percentage of users who adopt an additional feature or add-on relative to total users.
Definition and Context
This section defines Attach Rate and explains how it differs from other common metrics in analytics.
-
Core definition
Attach Rate measures the percentage of users or sessions that engage with an add-on feature, service, or product compared to the total user base or sessions.
-
Attach rate vs conversion rate
Where conversion rate tracks primary goal completions (e.g., checkouts), attach rate specifically measures uptake of secondary or supplementary offerings, such as premium features or cross-sell products.
Importance of Attach Rate
Understanding Attach Rate helps teams optimize revenue streams and prioritize product improvements.
-
Measure upsell and cross-sell performance
Attach Rate quantifies how effectively existing users adopt additional offerings, guiding marketing campaigns and pricing adjustments.
-
Inform product development
High or low attach rates signal which features resonate with users, helping product teams allocate resources and refine roadmaps.
Calculating Attach Rate
Learn how to compute Attach Rate and interpret its values in different contexts.
-
Basic formula
\nAttach Rate = (Number of users adopting the add-on ÷ Total number of users) × 100\n -
User-level vs session-level
User-level attach rate measures unique users adopting a feature, while session-level attach rate counts each session in which the feature is used.
Example Implementation in Analytics Tools
Step-by-step examples for tracking Attach Rate in GA4 and plainSignal.
-
Google analytics 4 (GA4)
- Define a custom event (e.g.,
feature_attach) when users adopt the feature. - In GA4 Admin, go to Events > Create event and configure the trigger.
- Use the Explore section to build a funnel or card showing the ratio of
feature_attachevents tosession_startoruser_engagementmetrics.
- Define a custom event (e.g.,
-
PlainSignal (cookie-free analytics)
Integrate plainSignal and log attach events without cookies.
Include the tracking snippet:
<link rel="preconnect" href="//eu.plainsignal.com/" crossorigin />
<script defer data-do="yourwebsitedomain.com" data-id="0GQV1xmtzQQ" data-api="//eu.plainsignal.com" src="//cdn.plainsignal.com/plainsignal-min.js"></script>
Then call the plainSignal API to record an
attachevent when the user opts in, and view attach rate in your plainSignal dashboard.
Best Practices
Recommendations to ensure accurate and actionable attach rate analysis.
-
Segment your analysis
Break down attach rate by user cohorts, demographics, or traffic sources to uncover targeted insights.
-
Track over time
Monitor attach rate trends across product releases and marketing campaigns to evaluate the impact of changes.
Limitations and Considerations
Be aware of common pitfalls and context when interpreting attach rate metrics.
-
Data quality
Ensure accurate event instrumentation; missing or duplicate events can skew attach rate calculations.
-
Context matters
A low attach rate may be acceptable for niche or premium features; always align benchmarks with product strategy and user expectations.