Published on 2025-06-28T08:04:06Z
What is Comparative Analysis in Analytics? Examples with GA4 and PlainSignal
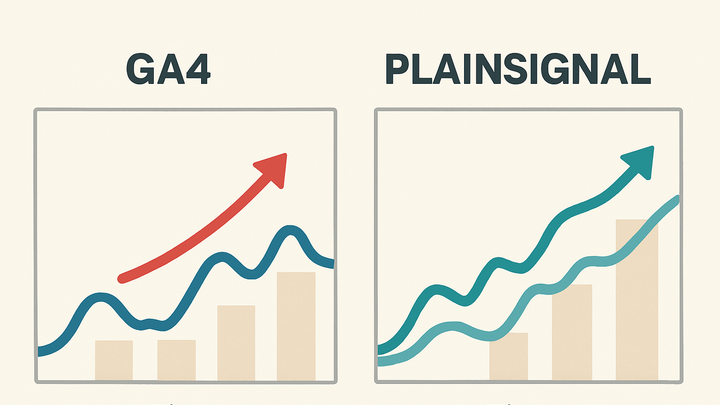
Comparative analysis in analytics involves evaluating and contrasting key performance metrics across different dimensions, such as time periods, user segments, or marketing channels. By benchmarking data side by side, analysts can identify trends, anomalies, and opportunities for optimization. This method is crucial for understanding how changes to a website, campaign, or product affect user behavior over time or across demographics. Tools like Google Analytics 4 (GA4) offer robust exploration and comparison features to slice and dice data, while privacy-focused platforms like PlainSignal provide straightforward ways to compare metrics without relying on cookies. Whether you’re measuring week-over-week traffic shifts or comparing engagement between organic and paid channels, comparative analysis unlocks actionable insights that drive strategic decisions. By systematically comparing metrics, organizations can detect performance shifts early, allocate budgets more effectively, and tailor experiences to user needs.
Comparative analysis
Comparative analysis evaluates metrics across dimensions or periods to reveal performance differences and insights for data-driven decisions.
Why Comparative Analysis Matters
Comparative analysis provides context to raw data by highlighting differences and trends across various dimensions. It helps analysts understand performance shifts over time, between user segments, or across marketing channels. By comparing metrics side by side, you can detect anomalies, validate hypotheses, and make informed decisions. This approach uncovers underlying causes of performance changes rather than relying on absolute numbers alone. Ultimately, it guides resource allocation and strategy adjustments to maximize ROI.
-
Contextualizing data
Translating raw metrics into meaningful insights by placing them in comparison to past performance or benchmarks.
-
Identifying trends and anomalies
Spotting patterns or outliers that could indicate opportunities or issues requiring further investigation.
Common Approaches to Comparative Analysis
There are several standard methods for conducting comparative analysis depending on what you want to compare. These include analyzing changes over different time frames, evaluating distinct user segments, and contrasting performance across channels. Each approach offers unique insights and can be combined for more granular analysis. Choosing the right method depends on your goals, available data, and the analytics tools at your disposal.
-
Time period comparison
Evaluating metrics such as sessions, conversions, or revenue across defined time intervals.
-
Week-over-week
Comparing data from the current week to the previous week to assess short-term fluctuations.
-
Month-over-month
Analyzing month-to-month changes for longer-term trend identification.
-
-
Segment comparison
Contrasting metrics between different user groups based on behavior, demographics, or acquisition source.
-
New vs. returning users
Comparing engagement and conversion rates to understand user loyalty.
-
Geographical segments
Evaluating performance across regions to tailor localization strategies.
-
-
Channel comparison
Assessing traffic and conversion metrics across various marketing channels to optimize spend.
-
Organic vs. paid traffic
Balancing investments between SEO and paid campaigns for cost-effective growth.
-
Referral source analysis
Identifying high-value referral partners by comparing referral performance.
-
Implementing Comparative Analysis in GA4
Google Analytics 4 offers advanced features for comparing metrics using its Explorations tool and built-in report comparisons. By leveraging custom reports, you can apply comparisons to any dimension or metric, enabling deep dives into user behavior. GA4’s event-based model allows for flexible analysis across various touchpoints, making it easier to see how specific events drive performance differences. Integration with Google Ads and BigQuery further extends comparative capabilities for holistic cross-channel insights.
-
Using GA4 explorations
GA4’s Explorations provides a drag-and-drop interface for building custom reports with comparison segments.
-
Building a free-form report
Add dimensions and metrics to visualize data with tables, charts, and pivot tables.
-
Applying comparison segments
Define cohorts or date ranges directly in Explorations to see side-by-side data.
-
-
Custom reports and comparisons
Set up comparison filters in standard or custom reports to benchmark performance against previous periods or segments.
-
Date range comparison
Use the date range selector to compare current data to a previous period.
-
Dimension comparisons
Apply secondary dimensions and comparison filters to drill down into specific user attributes.
-
Implementing Comparative Analysis in PlainSignal
PlainSignal is a privacy-focused analytics platform offering simple, cookie-free tracking and easy-to-use comparison features. With a lightweight script, it rapidly collects essential metrics and presents side-by-side views of data without overwhelming complexity. PlainSignal’s interface enables quick comparisons of timeframes and segments, making it ideal for teams seeking straightforward insights while respecting user privacy regulations like GDPR and CCPA.
-
Setting up PlainSignal
Install the PlainSignal tracking script and verify data flow into your analytics dashboard.
-
Integrating tracking code
Paste the following snippet into the <head> section of your HTML:
<link rel="preconnect" href="//eu.plainsignal.com/" crossorigin /> <script defer data-do="yourwebsitedomain.com" data-id="0GQV1xmtzQQ" data-api="//eu.plainsignal.com" src="//cdn.plainsignal.com/plainsignal-min.js"></script> -
Verifying data collection
Check the PlainSignal dashboard to ensure page views and events are recorded correctly.
-
-
Running comparative reports
Use PlainSignal’s built-in comparison tools to analyze performance by selecting date ranges or filtering by segments.
-
Filtering by timeframes
Select custom date ranges to compare weekly, monthly, or custom periods.
-
Comparing metrics side-by-side
View charts that overlay two periods or segments for direct comparison of key metrics.
-
