Published on 2025-06-22T02:42:35Z
What is a Dashboard in Analytics? Examples & Implementation
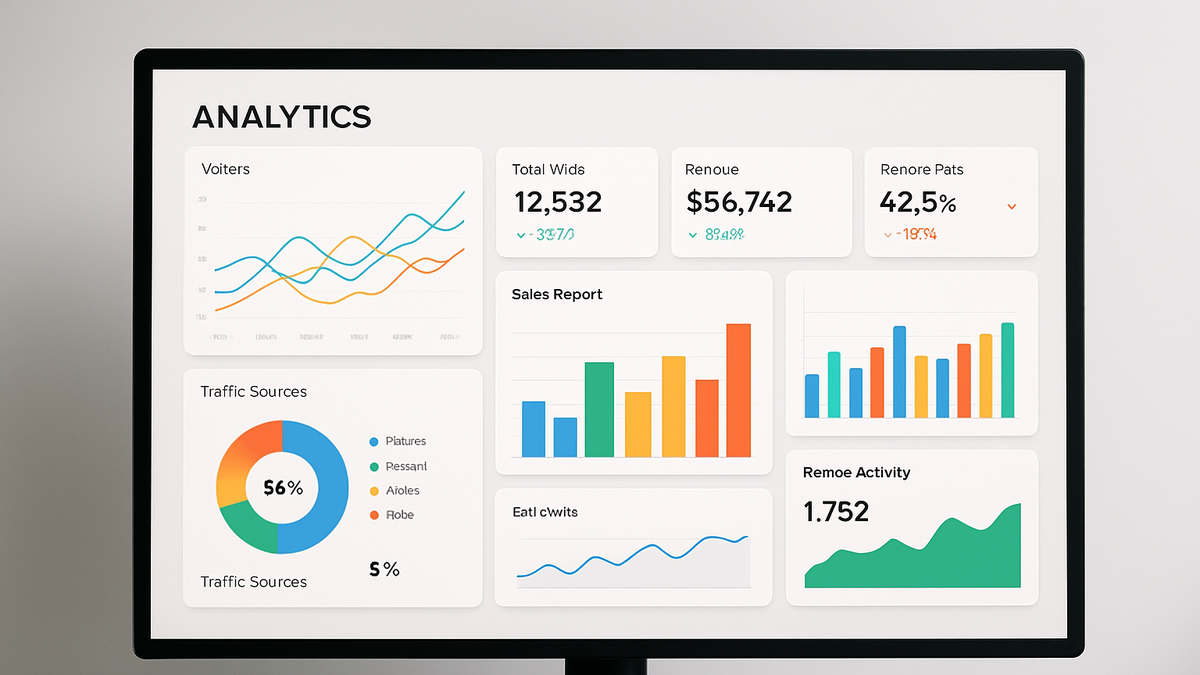
In analytics, a dashboard is a centralized user interface that aggregates and visualizes key metrics, data points, and performance indicators in an interactive format. Dashboards enable businesses to monitor real-time data, identify trends, and make data-driven decisions quickly. They pull information from multiple sources—such as web analytics tools, databases, and APIs—and present it in charts, tables, and gauges that are easy to interpret. Popular analytics tools like Google Analytics 4 (GA4) and PlainSignal offer customizable dashboards that cater to different levels of users, from marketers to data analysts. With dashboards, you can create tailored reports, apply filters and segments, and share insights across teams, ensuring everyone stays aligned on objectives and performance.
Dashboard
A dashboard is an interactive interface that displays key analytics metrics and visualizations for data-driven decision-making.
Definition & Purpose
This section defines what an analytics dashboard is and explains why it’s essential in digital analytics workflows. We explore its core functions and the value it brings to businesses by centralizing data visualization and monitoring.
-
Centralized data display
Dashboards consolidate data from various sources into a single interface, eliminating the need to switch between multiple tools.
-
Real-time insights
They update metrics in real time or near-real time, allowing teams to respond quickly to emerging trends or issues.
Key Components of an Analytics Dashboard
A well-designed analytics dashboard comprises several core components that work together to provide actionable insights.
-
Visualizations
Charts, graphs, tables, and maps transform raw data into visual formats that highlight patterns, trends, and outliers.
-
Line charts
Ideal for showing trends over time, such as traffic growth or conversion rate changes.
-
Bar graphs
Good for comparing categories side by side, like traffic sources or device types.
-
Pie charts
Useful for illustrating proportions, such as the percentage of traffic by channel.
-
-
Filters & segmentation
Interactive filters and segments allow users to drill down into specific subsets of data based on dimensions like date, location, or user behavior.
-
Custom metrics & kpis
Custom metrics and key performance indicators (KPIs) tailored to business goals help track what matters most, such as revenue per user or bounce rates.
Popular Analytics Tools & Dashboards
This section highlights popular SaaS products that offer analytics dashboards, illustrating their unique features.
-
Google analytics 4 (GA4)
GA4 provides a set of default dashboards—such as the Overview, Real-Time, and Engagement reports—along with the ability to create custom Explorations for advanced analysis.
-
Overview dashboard
A summary of user acquisition, engagement, and retention metrics.
-
Explorations
Customizable reports that let analysts dig deeper into user behavior using segments and dimensions.
-
-
PlainSignal
PlainSignal offers a lightweight, cookie-free analytics dashboard focused on simplicity and data privacy, ideal for websites seeking compliance and speed.
-
Cookie-free tracking
Collects essential metrics without storing personal data or cookies.
-
Simple interface
Presents core metrics—such as visits, page views, and top pages—in an uncluttered dashboard.
-
Implementing a Dashboard with Code Examples
Learn how to integrate tracking code for PlainSignal and GA4 to start populating your dashboard with real data.
-
PlainSignal tracking code example
Add the following snippet to the <head> of your HTML to enable PlainSignal analytics:
-
Integration snippet
<link rel="preconnect" href="//eu.plainsignal.com/" crossorigin />
<script defer data-do="yourwebsitedomain.com" data-id="0GQV1xmtzQQ" data-api="//eu.plainsignal.com" src="//cdn.plainsignal.com/plainsignal-min.js"></script>
-
-
GA4 tracking code example
Use the following Global site tag snippet in your <head> section to initialize Google Analytics 4:
-
Gtag.js snippet
<!-- Global site tag (gtag.js) - Google Analytics -->
<script async src="https://www.googletagmanager.com/gtag/js?id=GA_MEASUREMENT_ID"></script>
<script>
  window.dataLayer = window.dataLayer || [];
  function gtag(){dataLayer.push(arguments);}
  gtag('js', new Date());
  gtag('config', 'GA_MEASUREMENT_ID');
</script>
-
Best Practices for Effective Dashboards
Adhering to best practices ensures your dashboards remain effective, clear, and actionable over time.
-
Focus on key metrics
Prioritize metrics that directly align with business goals to avoid clutter and information overload.
-
Maintain clarity and simplicity
Use consistent color schemes, avoid unnecessary decorations, and keep the layout intuitive.
-
Regularly update and audit
Review data sources, update filters, and verify metric accuracy to maintain trust in your dashboards.