Published on 2025-06-28T06:23:21Z
What is Business Intelligence? Examples and Key Components
Business Intelligence (BI) is the process of collecting, integrating, analyzing, and presenting business data to support decision-making across an organization. BI solutions combine data warehousing, reporting, dashboards, and analytical tools to turn raw data into actionable insights. By centralizing data from multiple sources, BI ensures consistency and reliability, enabling stakeholders to track performance, identify trends, and forecast outcomes. BI is crucial for improving operational efficiency, uncovering new opportunities, and maintaining a competitive edge. As businesses generate increasing volumes of data, robust BI strategies become essential for data-driven growth.
Business intelligence
BI involves collecting, integrating, and analyzing data to generate actionable insights for business decisions.
Definition and Context
Business Intelligence (BI) combines strategies, tools, and technologies to collect, integrate, analyze, and present business data. It helps organizations turn raw data into actionable insights and supports data-driven decision-making across all levels of an enterprise. BI encompasses processes like data warehousing, reporting, dashboards, and analytics. Understanding BI is essential for optimizing operations, improving performance, and gaining competitive advantage.
-
What is business intelligence?
BI refers to the methodologies and technologies used to transform data into meaningful insights. It covers data collection, storage, analysis, and visualization to support strategic and operational decisions.
-
Bi vs. analytics
While ‘analytics’ often refers to the techniques used to interpret data, ‘Business Intelligence’ typically covers the end-to-end process of data management, reporting, and visualization to inform business strategies.
Core Components of Business Intelligence
The effectiveness of BI depends on its core components, which work together to manage and analyze business data. These components ensure data is accessible, reliable, and presented in a user-friendly manner.
-
Data warehousing
A centralized repository where data from multiple sources is stored and organized for efficient querying and analysis.
-
Etl processes
Extract, Transform, Load (ETL) pipelines gather data from various sources, clean and transform it, then load it into the warehouse.
-
Storage and retrieval
Optimized database structures and indexing techniques ensure fast retrieval of large datasets.
-
-
Reporting and dashboards
Tools that generate structured reports and interactive dashboards, enabling stakeholders to monitor KPIs and metrics at a glance.
-
Interactive visualizations
Dynamic charts, graphs, and drill-down interfaces that allow users to explore data visually.
-
-
Data analysis and query tools
Software that permits querying the data warehouse, performing ad-hoc analyses, and applying statistical or predictive models.
BI in Practice: SaaS Examples
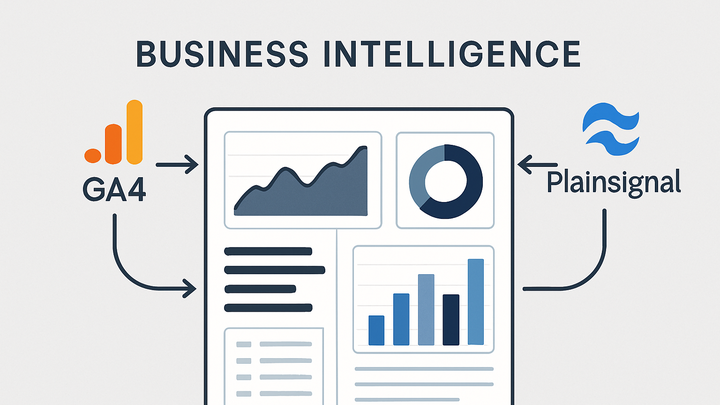
Modern BI platforms often integrate with popular SaaS analytics tools for comprehensive data collection and reporting. Here are examples using GA4 and PlainSignal.
-
Example using google analytics 4 (GA4)
GA4 tracks user interactions across websites and apps. You can export GA4 data into a BI tool or Google Data Studio to create custom dashboards and reports. This integration enables advanced segmentation, cross-device tracking, and predictive insights.
-
Tracking website traffic
Implement the GA4 tag on your website to collect pageviews, events, and user properties.
-
Building dashboards
Use Google Data Studio or another BI tool to connect to GA4 and design interactive dashboards for key metrics.
-
-
Example using PlainSignal
PlainSignal offers simple, cookie-free analytics that ensure privacy compliance while providing essential metrics. Embed the following script to start collecting data:
-
Integration snippet
<link rel="preconnect" href="//eu.plainsignal.com/" crossorigin /> <script defer data-do="yourwebsitedomain.com" data-id="0GQV1xmtzQQ" data-api="//eu.plainsignal.com" src="//cdn.plainsignal.com/plainsignal-min.js"></script> -
Simple dashboard setup
View PlainSignal’s lightweight dashboards to monitor visitors, pageviews, and event metrics without cookies.
-
Benefits and Challenges
BI delivers significant advantages but also faces challenges. Understanding both helps organizations implement BI effectively.
-
Benefits of bi
BI empowers businesses to make informed decisions, optimize processes, and uncover growth opportunities.
-
Improved decision-making
Real-time data and historical trends enable timely, evidence-based decisions.
-
Operational efficiency
Automated reporting and alerts reduce manual effort and streamline workflows.
-
-
Challenges in bi implementation
Successful BI requires high-quality data, skilled personnel, and careful planning.
-
Data quality and integration
Inconsistent or siloed data can lead to inaccurate insights if not properly managed.
-
Change management
Adoption challenges and training requirements can hinder BI project success.
-
