Published on 2025-06-26T04:20:24Z
What is OLAP? Understanding Online Analytical Processing in Analytics
OLAP (Online Analytical Processing) is a category of software technology that enables analysts to query multi-dimensional data interactively from multiple perspectives.
OLAP systems allow fast retrieval of aggregated data, supporting complex analytical queries. It contrasts with OLTP (Online Transaction Processing) systems, which prioritize transaction speed and data integrity for routine operations.
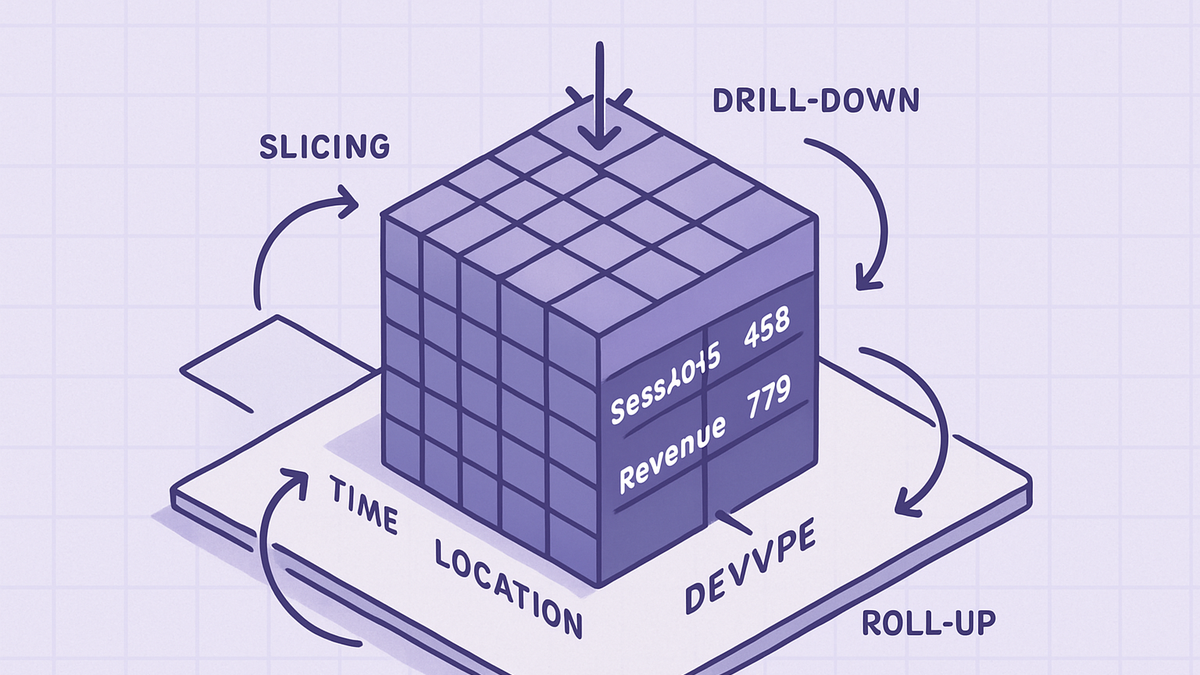
By organizing data into cubes defined by dimensions (e.g., time, geography, product) and measures (e.g., revenue, sessions), OLAP supports slicing, dicing, drill-down, and roll-up operations.
Commonly used in business intelligence and analytics platforms like Google Analytics 4 (GA4) with BigQuery and open data tools, OLAP helps uncover trends, anomalies, and insights from large datasets.
Even simple analytics tools like PlainSignal can integrate with OLAP processes by exporting raw event data for cube-based analysis in external data warehouses.
OLAP underpins dashboard visualizations, ad hoc reporting, and historical trend analysis across industries.
Olap
OLAP organizes data into multi-dimensional cubes for fast, ad hoc analytics, supporting slicing, dicing, drill-down, and roll-up operations.
Why OLAP Matters in Analytics
In modern analytics, speed and flexibility are crucial for decision-making. OLAP provides these by pre-aggregating data and organizing it into structures that support agile queries. Analysts can explore data from different angles without waiting for long query times. This capability is essential for creating dashboards, generating reports, and performing ad hoc investigations into user behavior, marketing performance, and business trends.
-
Multi-dimensional analysis
OLAP structures data into cubes where each axis represents a dimension (e.g., time, geography, channel) and cell values represent measures.
-
Dimensions
Qualitative attributes such as date, location, or product category used to slice the data.
-
Measures
Quantitative metrics like pageviews, sessions, or revenue aggregated within dimensions.
-
-
Drill-down and roll-up
Analysts can navigate between levels of data granularity, from summarized overviews to detailed records.
-
Drill-down
Breaking aggregated data into finer levels, such as drilling from yearly sales down to daily sales.
-
Roll-up
Aggregating detailed data into higher-level summaries, such as rolling up daily sales into monthly totals.
-
-
Ad-hoc querying
Performing spontaneous and flexible queries without predefined reports or rigid workflows.
-
Slicing
Selecting a subset of the cube by fixing a single dimension value (e.g., all sales in Q1).
-
Dicing
Conceptually similar to slicing but allows specifying multiple dimensions (e.g., sales in Q1 for specific regions).
-
Core OLAP Concepts and Terminology
Understanding the foundational concepts of OLAP is key to leveraging its full potential. From cubes to the query languages that interact with them, each element plays a role in how analysts interpret and manipulate data.
-
Olap cubes
A multi-dimensional array of data organized into dimensions and measures, providing a logical structure for analysis.
-
Slicing
Extracting a two-dimensional subset of the cube by specifying a value for one dimension.
-
Dicing
Creating a sub-cube by specifying values for two or more dimensions.
-
Pivoting (rotate)
Reorienting the multidimensional view of data, swapping rows and columns to explore different perspectives.
-
Mdx (multidimensional expressions)
A query language for OLAP databases, enabling complex calculations and data retrieval from cubes.
OLAP vs OLTP
While OLAP and OLTP both process data, they serve different purposes and have distinct architectures. Recognizing their differences is crucial for designing systems that balance transactional efficiency and analytical depth.
-
Oltp (online transaction processing)
Optimized for high-volume, short-duration transactions such as inserts, updates, and deletes in real-time applications.
-
Olap
Optimized for complex read queries and multi-dimensional analysis of historical data, typically involving large data volumes and aggregations.
-
Key differences
OLTP uses normalized schemas (3NF) for consistency, while OLAP favors denormalized star or snowflake schemas for query performance.
-
Schema design
OLTP: Normalized structures; OLAP: Star/snowflake schemas.
-
Workload characteristics
OLTP: Many short transactions; OLAP: Complex queries over large datasets.
-
Implementing OLAP in SaaS Analytics Platforms
Modern SaaS analytics platforms often offer ways to leverage OLAP techniques either natively or through integrations. Below are examples using PlainSignal (cookie-free analytics) and Google Analytics 4 (GA4).
-
PlainSignal data export for olap
PlainSignal focuses on simple, privacy-friendly analytics. While it doesn’t provide built-in OLAP cubes, you can export raw event data and load it into a data warehouse like BigQuery, Snowflake, or Apache Druid to build cubes and perform multi-dimensional analysis.
Example tracking code:
<link rel="preconnect" href="//eu.plainsignal.com/" crossorigin /> <script defer data-do="yourwebsitedomain.com" data-id="0GQV1xmtzQQ" data-api="//eu.plainsignal.com" src="//cdn.plainsignal.com/plainsignal-min.js"></script> -
GA4 and bigquery integration
Google Analytics 4 can stream event data directly to BigQuery, enabling OLAP-style queries with SQL. By creating a star schema in BigQuery, you can slice, dice, and aggregate GA4 data for custom dashboards or reports.
Example query:
SELECT event_name, COUNT(*) AS event_count
FROM `project.analytics_123456789.events_*`
WHERE _TABLE_SUFFIX BETWEEN '20250101' AND '20250131'
GROUP BY event_name;
Best Practices for OLAP Deployment
To ensure efficient and reliable OLAP systems, consider these best practices in architecture, data modeling, and governance.
-
Star schema design
Use a central fact table for measures and surrounding dimension tables for attributes. This denormalized structure enhances query performance.
-
Fact tables
Contain quantitative data (metrics) and foreign keys to dimensions.
-
Dimension tables
Store descriptive attributes and hierarchies for slicing and dicing.
-
-
Pre-aggregation strategies
Precompute summaries at various granularities to reduce query time for common aggregations.
-
Data governance and security
Implement strict access controls, audit trails, and data-quality checks to maintain trustworthiness and compliance.