Published on 2025-06-27T21:52:17Z
What is a Derived Metric? Examples and Use Cases
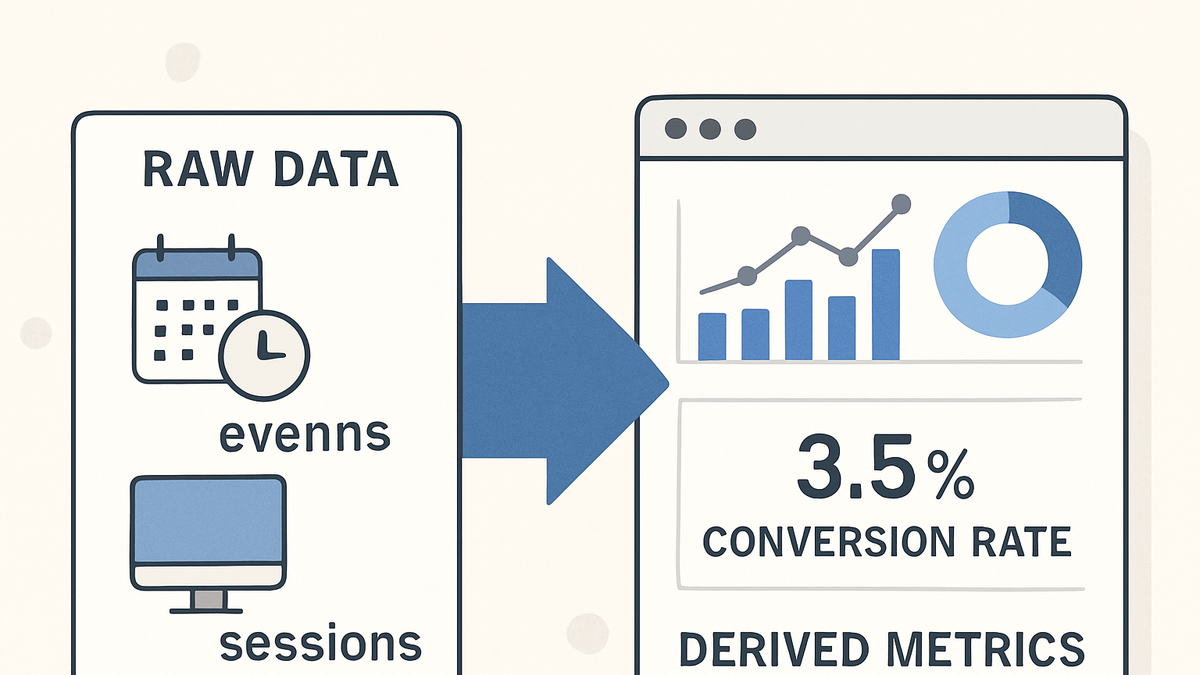
Derived metrics are custom metrics generated by applying mathematical operations or transformations to one or more raw metrics or dimensions. They extend the default metrics in analytics platforms to deliver tailored insights aligned with specific business objectives.
Key characteristics:
- Calculated from existing data such as sessions, events, conversions, or revenue.
- Defined using formulas or expressions, for example, Conversion Rate = (Conversions / Sessions) × 100.
- Can be created directly in platforms like GA4 or computed externally through APIs and scripting.
Derived metrics empower analysts to:
- Uncover efficiency ratios and performance benchmarks.
- Track custom KPIs that reflect unique business goals.
- Ensure consistency and comparability in dashboards and reports.
Derived metric
A custom KPI computed by applying formulas or transformations to raw analytics data.
Definition of Derived Metric
Derived metrics are custom metrics calculated by applying mathematical operations or transformations to existing raw metrics and dimensions. Unlike standard metrics provided out-of-the-box by analytics tools, derived metrics let you tailor calculations—such as ratios, percentages, or averages—to your specific measurement needs.
-
Core concept
A derived metric is computed from one or more base metrics. For instance, Conversion Rate is calculated as (Conversions / Sessions) × 100.
-
Common examples
- Conversion Rate: (Conversions / Sessions) × 100
- Bounce Rate: (Single-Page Sessions / Sessions) × 100
- Average Order Value: Revenue / Transactions
Why Derived Metrics Matter
Derived metrics transform raw data into actionable insights, revealing patterns that single metrics cannot capture. They bridge the gap between basic data collection and strategic decision-making by synthesizing multiple data points into meaningful performance indicators.
-
Enhanced insights
Combining metrics uncovers relationships like efficiency and quality, e.g., understanding how session length impacts conversion rate.
-
Customized kpis
Track metrics tailored to your business objectives, such as Engagement Rate or Churn Rate, which may not be available by default.
-
Consistent reporting
Standardizing formulas for derived metrics ensures uniform calculations across dashboards and teams, reducing confusion.
Creating Derived Metrics in GA4
Google Analytics 4 (GA4) offers built-in support for custom and derived metrics both in the interface and via reporting tools like Looker Studio. This allows analysts to define metrics without external processing.
-
GA4 interface
In GA4, go to Admin > Custom Definitions > Custom Metrics and click ‘Create custom metric’. Define a name, unit (e.g., percent), and enter a formula using existing metrics and parameters.
-
Looker studio
Connect your GA4 data source in Looker Studio. Click ‘Add a Field’ and enter your formula, such as
Conversions/Sessions*100, to visualize the derived metric alongside your report.
Implementing Derived Metrics with plainSignal
plainSignal is a cookie-free, lightweight analytics platform that captures raw events like pageviews and custom events. Since it doesn’t compute derived metrics on the fly, you can extract raw data via its API and calculate metrics in your own code or reporting layer.
-
Embedding tracking code
Include the following snippet in your HTML to start collecting raw metrics:
-
Tracking code
<link rel="preconnect" href="//eu.plainsignal.com/" crossorigin />
<script defer data-do="yourwebsitedomain.com" data-id="0GQV1xmtzQQ" data-api="//eu.plainsignal.com" src="//cdn.plainsignal.com/plainsignal-min.js"></script>
-
-
Calculating conversion rate
Fetch sessions and conversion events via the plainSignal API, then derive the conversion rate in code:
-
Example code
const response = await fetch('https://eu.plainsignal.com/api/metrics?start=2025-01-01&end=2025-01-31');
const { sessions, events } = await response.json();
const conversions = events.filter(e => e.name === 'purchase').length;
const conversionRate = (conversions / sessions) * 100;
console.log(`Conversion Rate: ${conversionRate.toFixed(2)}%`);
-
Best Practices and Pitfalls
While derived metrics unlock powerful insights, improper implementation can lead to misinterpretation. Follow these guidelines to maintain accuracy and clarity:
-
Clear naming and documentation
Use descriptive names and document the formula and data sources in a shared repository to align your team.
-
Performance optimization
Complex formulas can slow down queries. Consider pre-computing heavy metrics during data ingestion when possible.
-
Regular validation
Periodically compare derived metrics against raw data samples to catch calculation errors or data discrepancies early.