Published on 2025-06-28T06:22:10Z
What is Drop-off Rate? Measuring User Attrition in Analytics
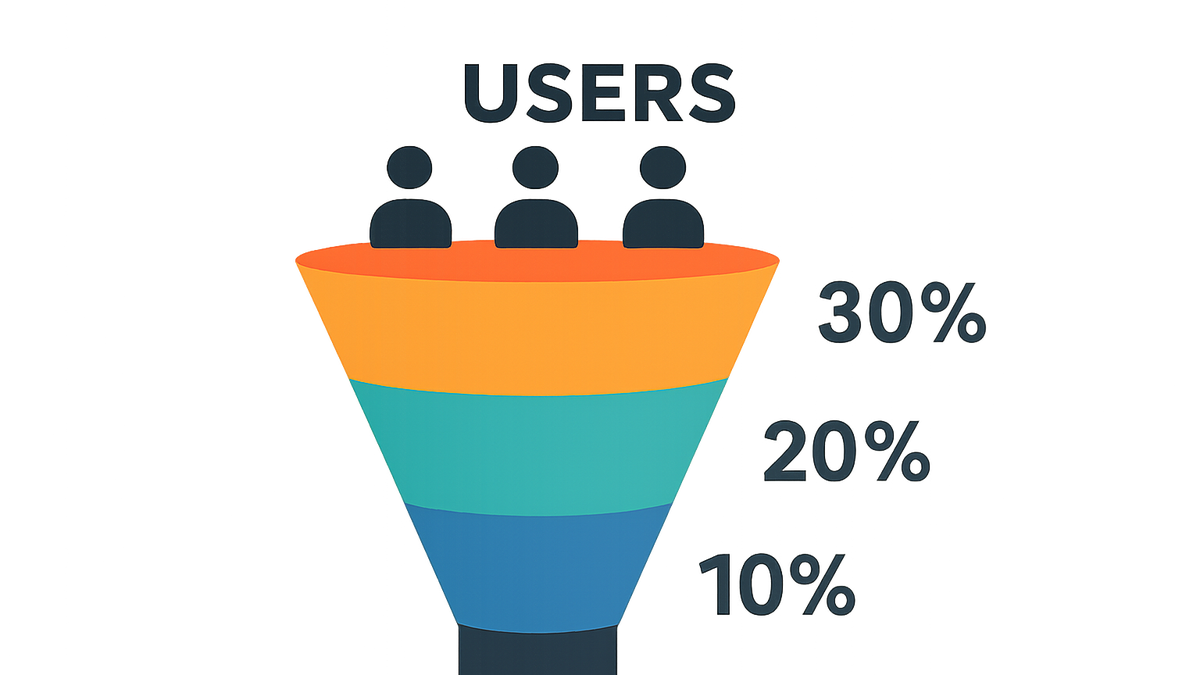
A drop-off rate measures the percentage of users who abandon a defined sequence of steps (also known as a funnel) on your website or app. It highlights the points in a user journey where engagement wanes and users leave before completing a desired action, such as completing a purchase or signing up for a newsletter. Drop-off rate is calculated by comparing the number of users who reach a given step to those who proceed to the next. By analyzing drop-off at each stage, businesses can identify friction points and optimize the experience to improve conversion. Tools like PlainSignal and Google Analytics 4 (GA4) provide built-in reports and exploration features that make it easy to track and interpret drop-off rates across multi-step processes.
Drop-off rate
The percentage of users abandoning a defined sequence step in a funnel, showing where engagement or conversion is lost.
Understanding Drop-off Rate
This section defines drop-off rate, explains its formula, and discusses why it’s a critical metric for tracking user attrition in multi-step processes.
-
Definition
Drop-off rate is the proportion of users who do not move from one step to the next in a defined funnel.
-
Calculation formula
Drop-off rate between step N and N+1 = ((Users at step N - Users at step N+1) / Users at step N) × 100%.
-
Business impact
High drop-off rates indicate friction or confusion in the user experience; reducing drop-offs can significantly boost conversions and revenue.
Measuring Drop-off Rate with Analytics Tools
Learn how to implement and measure drop-off rates using PlainSignal and GA4, with code snippets and report setup guidelines.
-
PlainSignal implementation
PlainSignal is a cookie-free analytics solution that can track user steps and drop-off via a simple script.
-
Tracking code
Add the following to your site’s <head>:
<link rel="preconnect" href="//eu.plainsignal.com/" crossorigin />
<script defer data-do="yourwebsitedomain.com" data-id="0GQV1xmtzQQ" data-api="//eu.plainsignal.com" src="//cdn.plainsignal.com/plainsignal-min.js"></script>
-
-
GA4 implementation
Google Analytics 4 offers a Funnel Exploration report to visualize drop-off between defined events or pageviews.
-
Setting up the funnel
In GA4, go to ‘Explore’ → ‘Funnel Exploration’, then define each step by selecting events or page_url conditions.
-
Analyzing results
Review the drop-off percentages between steps and the overall completion rate to pinpoint where users are lost.
-
Best Practices to Reduce Drop-off
Strategies to optimize your funnel, improve user experience, and lower drop-off rates effectively.
-
Simplify checkout flows
Minimize form fields, offer guest checkout, and provide clear progress indicators.
-
Enhance page speed
Optimize load times as slow pages increase user abandonment.
-
Provide clear ctas
Use descriptive calls to action that guide users to the next step.
Common Pitfalls and How to Avoid Them
Avoid mistakes that can skew your drop-off analysis and lead to misguided optimizations.
-
Missing event tracking
If events or pageviews aren’t set up correctly, drop-off calculations will be inaccurate.
-
Ignoring segments
High-level drop-off rates may mask issues affecting specific user groups; segment your analysis.
-
Overlooking external factors
Consider seasonality, traffic quality, and device types that can influence user behavior.