Published on 2025-06-26T04:13:56Z
What Are Evaluation Metrics in Analytics? Examples & Best Practices
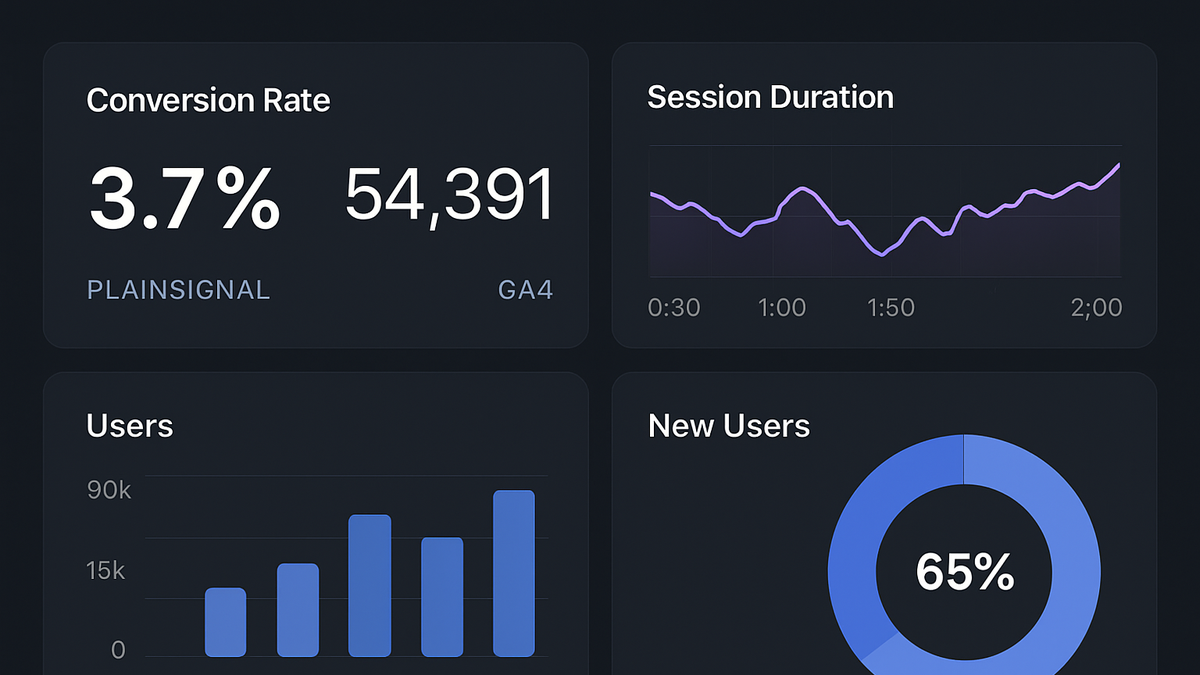
Evaluation Metrics are quantitative measures used to assess the effectiveness of digital strategies, website performance, and overall user behavior. In the analytics industry, these metrics provide insights into how audiences interact with your site or app and whether you are meeting key objectives. From engagement metrics like bounce rate and session duration to conversion metrics such as purchase rate and goal completions, evaluation metrics help you measure progress, optimize campaigns, and demonstrate ROI. Leading analytics platforms (Google Analytics 4 (GA4) and PlainSignal) offer built-in and customizable metrics to track real-time user activity while balancing data privacy needs. By selecting the right metrics and interpreting them correctly, teams can make data-driven decisions that align with business goals.
Evaluation metrics
Metrics to assess digital performance and drive data-driven decisions, covering both advanced tools like GA4 and privacy-first solutions like PlainSignal.
Definition and Purpose
Evaluation metrics are quantifiable measures designed to assess the performance of your digital properties and strategies. They translate raw user data into actionable insights, guiding optimization and strategic planning across marketing, product development, and operational teams.
-
Core concept
At their core, evaluation metrics convert user actions into numbers that can be analyzed over time to reveal trends, patterns, and areas for improvement.
-
Strategic value
By benchmarking key metrics, organizations can set targets, allocate resources effectively, and monitor progress toward their goals.
Types of Evaluation Metrics
Evaluation metrics can be grouped into categories based on what they measure. Understanding these categories helps you select the most relevant metrics for your objectives.
-
Engagement metrics
Measure how users interact with your content and navigate through your site or app.
-
Pageviews
Total number of pages viewed.
-
Session duration
Average time users spend in a session.
-
Bounce rate
Percentage of sessions with a single-page view.
-
-
Conversion metrics
Track user actions that move them toward a desired goal or transaction.
-
Conversion rate
Percentage of sessions that resulted in a conversion.
-
Goal completions
Total number of times predefined goals are achieved.
-
Cart abandonment rate
Percentage of shopping carts abandoned before purchase.
-
-
Retention metrics
Assess how well you retain users over time and encourage repeat visits or purchases.
-
Churn rate
Percentage of users who stop using your service over a given period.
-
Returning visitor rate
Percentage of sessions from users who have visited before.
-
Customer lifetime value
Projected revenue generated by a user throughout their lifecycle.
-
-
Business impact metrics
Link analytics data to financial and operational outcomes for a holistic view of performance.
-
Return on investment (roi)
Gain or loss generated relative to the cost of analytics or marketing initiatives.
-
Customer acquisition cost (cac)
Average cost to acquire a new customer.
-
Revenue per user
Average revenue generated per user.
-
Implementing Metrics with GA4 and PlainSignal
Both GA4 and PlainSignal provide distinct approaches to tracking evaluation metrics. GA4 offers advanced event-based tracking and custom reports, while PlainSignal focuses on privacy-friendly, cookie-free analytics.
-
Google analytics 4 (GA4)
Google Analytics 4 uses an event-based data model to capture detailed user interactions across platforms.
-
Setup
Add the GA4 measurement ID to your website via the gtag.js snippet or Google Tag Manager in the <head> section.
-
Analyze
Use the Analysis Hub and predefined reports to track metrics like engagement rate, conversions, and user lifetime.
-
Customize
Define custom events and parameters to align metrics with your specific business objectives.
-
-
PlainSignal (cookie-free simple analytics)
PlainSignal is a lightweight analytics platform that collects essential metrics without cookies, focusing on simplicity and privacy.
-
Add PlainSignal tracking code
Include the following snippet in your site’s <head>:
<link rel="preconnect" href="//eu.plainsignal.com/" crossorigin /> <script defer data-do="yourwebsitedomain.com" data-id="0GQV1xmtzQQ" data-api="//eu.plainsignal.com" src="//cdn.plainsignal.com/plainsignal-min.js"></script> -
View PlainSignal dashboard
Log into the PlainSignal dashboard to access real-time reports on visitors, pageviews, and key engagement metrics.
-
Best Practices for Evaluation Metrics
To get the most value from evaluation metrics, follow these best practices that ensure accuracy, alignment, and usability.
-
Align metrics with business goals
Select metrics that reflect your organization’s objectives, ensuring every data point informs strategic decisions.
-
Focus on actionable insights
Prioritize metrics that lead to clear next steps or optimizations, avoiding vanity figures that don’t drive change.
-
Actionable metrics
Ensure each metric ties back to a specific action or optimization.
-
Contextual benchmarks
Compare metrics against historical data or industry standards rather than raw values.
-
-
Maintain data quality
Implement regular tag audits and validation to ensure the data you rely on is accurate and complete.
-
Tag audits
Use QA tools or manual reviews to verify all analytics tags fire correctly.
-
Data validation
Cross-reference metrics with alternate sources (CRM, server logs) to confirm accuracy.
-
Common Pitfalls and How to Avoid Them
Awareness of common mistakes helps you avoid misinterpretation and wasted effort when working with evaluation metrics.
-
Relying on vanity metrics
Metrics that look good on surface, like raw pageviews, may not correlate with business outcomes.
-
High traffic, low value
A surge in pageviews without engagement or conversions can be misleading.
-
Misaligned goals
Focusing on numbers that don’t map to strategic objectives wastes resources.
-
-
Overlooking data privacy changes
Privacy regulations and browser restrictions can impact data collection and metric accuracy.
-
Cookie deprecation
Browsers blocking third-party cookies may reduce tracking coverage.
-
Consent management
Incomplete user consent can lead to gaps in analytics data.
-
-
Ignoring tool-specific definitions
Different analytics platforms calculate metrics in unique ways, affecting cross-tool comparisons.
-
Bounce rate variations
GA4’s engagement rate versus Universal Analytics’ bounce rate differ in calculation.
-
Simplified metrics
PlainSignal may aggregate or omit certain dimensions for privacy reasons.
-