Published on 2025-06-28T14:03:35Z
What is the F1 Score? Examples in Analytics
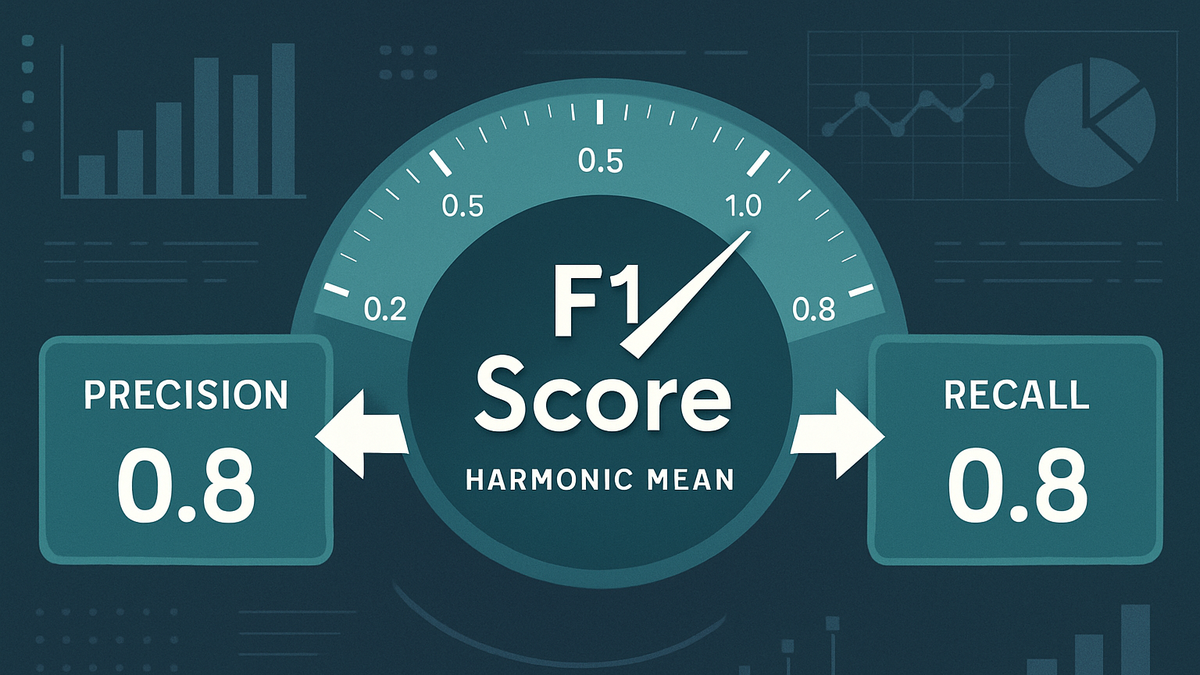
F1 Score is a classification performance metric that combines precision and recall into a single value using the harmonic mean. It ranges from 0 to 1, where a higher score indicates a better balance between precision (low false positives) and recall (low false negatives). F1 Score is particularly valuable in analytics when dealing with imbalanced datasets, such as user churn prediction or fraud detection.
By penalizing both false positives and false negatives equally, the F1 Score provides a more nuanced evaluation than accuracy alone. In platforms like Google Analytics 4 (GA4), you can derive F1 Scores by exporting data to BigQuery and running custom queries. In lightweight, cookie-free tools like PlainSignal, you can capture event data via a simple snippet and feed it into external ML pipelines to calculate the F1 Score.
Use the following code to implement PlainSignal on your site as a data source for F1 Score analysis:
<link rel="preconnect" href="//eu.plainsignal.com/" crossorigin />
<script defer data-do="yourwebsitedomain.com" data-id="0GQV1xmtzQQ" data-api="//eu.plainsignal.com" src="//cdn.plainsignal.com/plainsignal-min.js"></script>
F1 score
Combines precision and recall (harmonic mean) to evaluate classification models, ideal for imbalanced analytics datasets.
Definition & Importance
F1 Score is the harmonic mean of precision and recall and represents the balance between these two metrics. It helps analysts understand the trade-off between false positives and false negatives. This metric is crucial when class distributions are uneven, as it avoids the misleading high scores that accuracy can produce on skewed data.
-
Why f1 score matters
Balances false positives and false negatives for a robust evaluation of classification models.
-
Ideal use cases
Best suited for imbalanced datasets like churn prediction, fraud detection, or rare event tracking.
Calculating the F1 Score
F1 Score is computed from precision and recall. Understanding each component is essential before applying the formula.
-
Precision
The ratio of true positives to all predicted positives: TP / (TP + FP).
-
True positives (tp)
Correctly predicted positive instances.
-
False positives (fp)
Incorrectly predicted positive instances.
-
-
Recall
The ratio of true positives to all actual positives: TP / (TP + FN).
-
True positives (tp)
Correctly predicted positive instances.
-
False negatives (fn)
Actual positives missed by the model.
-
-
F1 formula
Harmonic mean of precision and recall: 2 × (Precision × Recall) / (Precision + Recall).
Implementing F1 Score in Analytics Platforms
Different analytics tools require distinct approaches to derive and visualize F1 Scores.
-
Google analytics 4 (GA4)
Use GA4’s BigQuery export to retrieve predicted and actual labels stored as event parameters. Run SQL queries to calculate precision, recall, and F1 Score over user segments or conversion events.
-
PlainSignal (cookie-free analytics)
Embed PlainSignal on your site to collect event data without cookies. Once data is collected, route it to an external ML pipeline or analysis tool to calculate precision, recall, and F1 Score.
Best Practices & Common Pitfalls
Insights and warnings when applying F1 Score in analytics.
-
Handling highly imbalanced data
When one class is extremely rare, consider complementary techniques like data sampling or alternative metrics to supplement F1 Score.
-
Threshold tuning
F1 Score depends on the classification threshold. Analyze how different thresholds impact precision and recall trade-offs.
-
Complementary metrics
Use accuracy, ROC-AUC, and precision-recall curves alongside F1 Score for a fuller performance overview.