Published on 2025-06-26T04:48:52Z
What Is a Confusion Matrix? Understanding Classification Performance
A confusion matrix is a tabular summary that shows how well a classification model performs by comparing actual labels against predicted labels. It breaks down predictions into four categories—True Positives, True Negatives, False Positives, and False Negatives—to reveal not just overall accuracy but the types of errors made. In analytics, this tool helps teams fine-tune models, allocate resources, and make data-driven decisions. You can build confusion matrices from event data collected via platforms like PlainSignal or GA4, then calculate metrics like precision and recall to evaluate specific aspects of performance. By visualizing where a model succeeds and fails, organizations gain actionable insights to improve predictive workflows and business outcomes.
Confusion matrix
A confusion matrix is a table used in analytics to evaluate classification models by comparing true vs. predicted outcomes across TP, TN, FP, and FN.
What Is a Confusion Matrix?
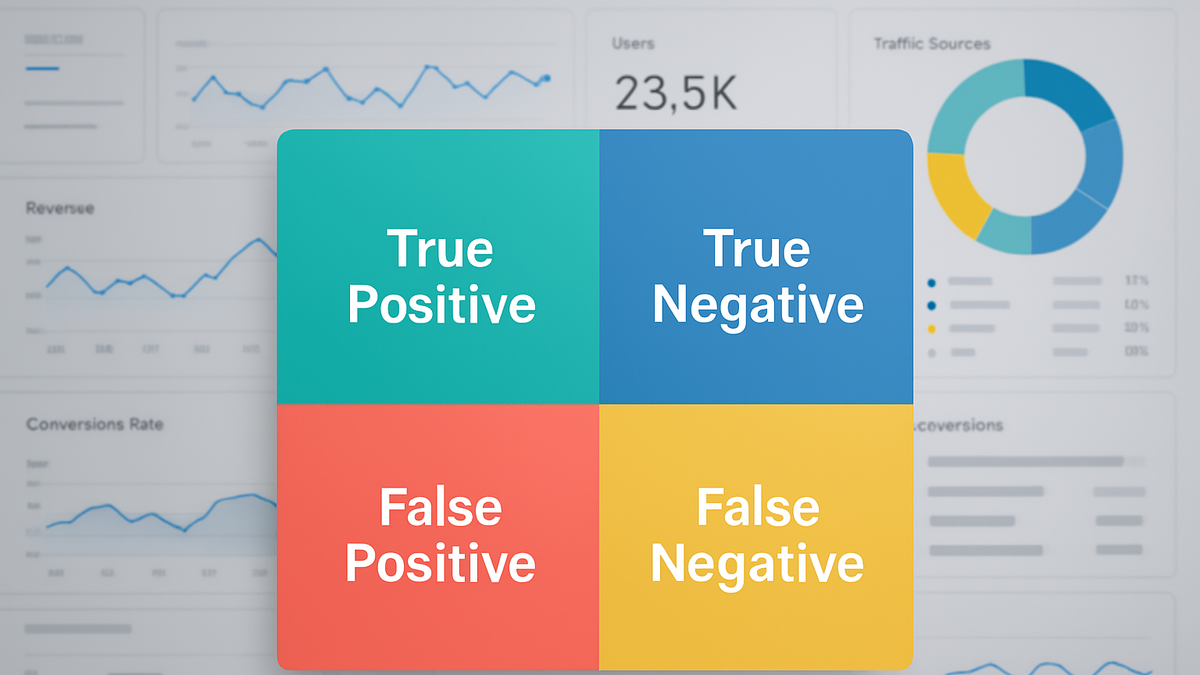
A confusion matrix is a foundational evaluation tool in classification analytics. It lays out the counts of correct and incorrect predictions in a simple 2×2 grid, enabling deep insights into model behavior and error types.
-
Definition
A confusion matrix is a table that compares actual (ground truth) and predicted class labels to categorize each prediction into four outcomes.
-
Why it matters
Beyond overall accuracy, it reveals specific error patterns—such as over-predicting positives or missing actual positives—guiding targeted model improvements.
Core Components
Every confusion matrix has four key cells. Understanding each cell is critical for interpreting model strengths and weaknesses.
-
True positive (tp)
The model predicted a positive class, and the actual label is positive.
-
True negative (tn)
The model predicted a negative class, and the actual label is negative.
-
False positive (fp)
The model predicted positive, but the actual label is negative (Type I error).
-
False negative (fn)
The model predicted negative, but the actual label is positive (Type II error).
Key Performance Metrics Derived
From the four core counts, analysts calculate metrics that summarize different aspects of classification quality.
-
Accuracy
Proportion of all correct predictions: (TP + TN) / (TP + TN + FP + FN).
-
Precision
Ratio of true positives to all predicted positives: TP / (TP + FP). It measures prediction reliability.
-
Recall (sensitivity)
Ratio of true positives to all actual positives: TP / (TP + FN). It measures ability to capture positive cases.
-
F1 score
Harmonic mean of precision and recall: 2 × (Precision × Recall) / (Precision + Recall). It balances both metrics.
Implementing a Confusion Matrix
You can collect prediction and outcome data via analytics platforms and compute a confusion matrix in your analysis environment or BI tool.
-
Using PlainSignal
PlainSignal provides cookie-free event tracking; tag predicted and actual outcomes as custom events, then export for analysis.
-
Tracking code snippet
<link rel="preconnect" href="//eu.plainsignal.com/" crossorigin />
<script defer data-do="yourwebsitedomain.com" data-id="0GQV1xmtzQQ" data-api="//eu.plainsignal.com" src="//cdn.plainsignal.com/plainsignal-min.js"></script>
-
-
Using google analytics 4 (GA4)
In GA4, define custom events for
predicted_labelandactual_label, then export to BigQuery to calculate and visualize confusion matrices.-
GA4 tagging example
gtag('event', 'classification_result', {
  'predicted_label': 'churn',
  'actual_label': 'churn'
});
-
Best Practices and Limitations
While confusion matrices are insightful, be mindful of data characteristics and business context when interpreting results.
-
Address class imbalance
When classes are uneven, metrics like accuracy can be misleading. Focus on precision, recall, and F1 score for balanced evaluation.
-
Ensure sufficient samples
Small sample sizes in any cell can lead to unreliable metrics. Collect adequate data for each class to gain confidence.
-
Align with business costs
Weigh the impact of false positives vs. false negatives differently depending on the use case (e.g., fraud detection vs. marketing outreach).