Published on 2025-06-26T05:24:03Z
What Is a Geo Experiment? Examples and Applications
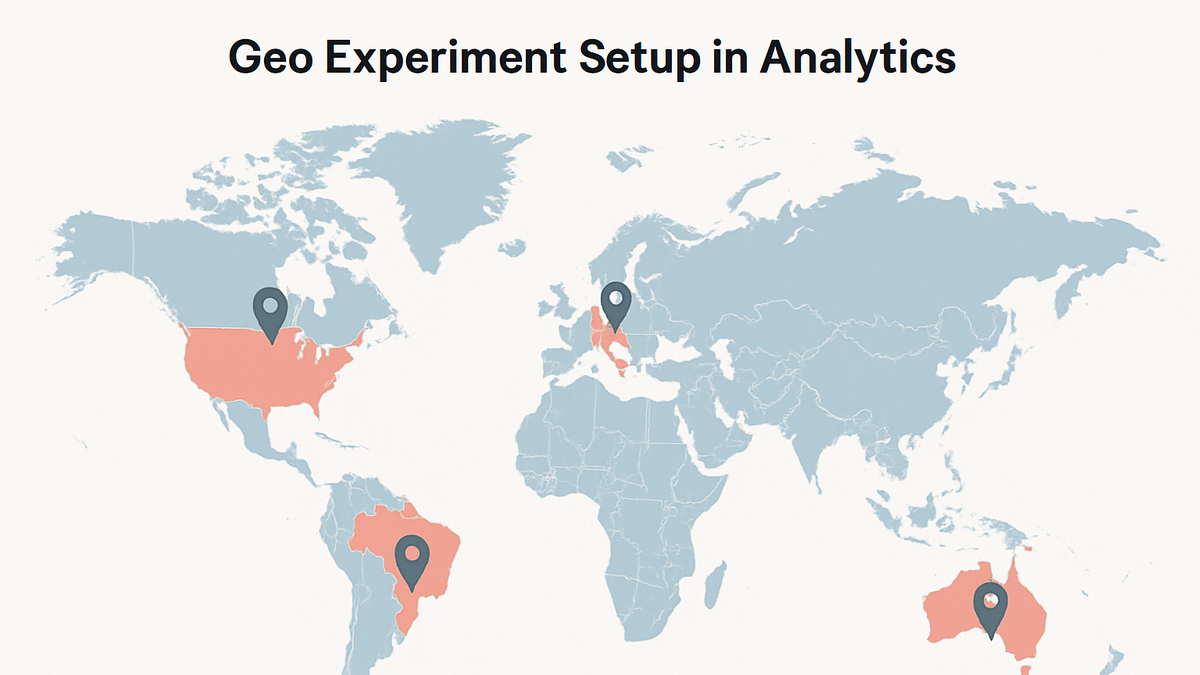
Geo Experiment is a methodology in digital analytics where entire geographic regions are allocated to control or treatment groups to measure the impact of specific interventions. By grouping users based on their location, organizations can assess campaign effectiveness, feature rollouts, or pricing strategies without cross-group contamination. This approach is ideal when individual user-level randomization is not feasible due to privacy constraints or technical limitations. Solutions like GA4 offer custom dimensions and audience segmentation to facilitate geo experiments, while cookie-free analytics platforms such as PlainSignal can track regional performance without relying on individual identifiers. Analysts can compare key metrics—such as conversion rate, average order value, and engagement—between test regions and their matched controls to calculate lift and statistical significance. Geo experiments also help isolate external factors like seasonality or local events by using staggered rollouts and rolling windows. Ultimately, a well-executed geo experiment empowers teams to make data-driven decisions across diverse markets.
Geo experiment
An A/B test that uses geographic regions as control and treatment groups to measure localized campaign or feature impact.
What Is a Geo Experiment?
A Geo Experiment assigns entire regions—such as countries, states, or cities—to either a treatment group that receives a change or a control group that remains unchanged. Unlike traditional A/B tests at the user level, geo experiments avoid user crossover but require careful selection of comparable regions. They help isolate the effect of marketing campaigns, product features, or pricing strategies in a privacy-compliant manner.
-
Definition
In analytics, a geo experiment uses geographic boundaries to segment users, applying interventions to entire regions rather than individuals.
-
When to use
Ideal when user-level randomization is impractical due to privacy regulations, measurement limitations, or the risk of spillover across user groups.
Setting Up a Geo Experiment
Follow these steps to launch a geo experiment: choose comparable regions, implement tracking code, and configure your analytics platforms.
-
Choosing geographical regions
Select regions with similar user demographics and traffic patterns. Ensure each region has sufficient volume to achieve statistical significance.
-
Implementing tracking code
Add PlainSignal tracking to your site:
<link rel="preconnect" href="//eu.plainsignal.com/" crossorigin /> <script defer data-do="yourwebsitedomain.com" data-id="0GQV1xmtzQQ" data-api="//eu.plainsignal.com" src="//cdn.plainsignal.com/plainsignal-min.js"></script> -
Configuring in GA4
In Google Analytics 4, define a custom dimension for region and create audiences for each geo cohort. Use the following snippet to send region as a user property:
<script async src="https://www.googletagmanager.com/gtag/js?id=G-XXXXXXX"></script>
<script>
window.dataLayer = window.dataLayer || [];
function gtag(){dataLayer.push(arguments);}
gtag('js', new Date());
mtg('config', 'G-XXXXXXX', {
  'user_properties': { 'region': 'US' }
});
</script>
Analyzing Results
After the experiment ends, compare key metrics across test and control regions to calculate lift and assess significance.
-
Key metrics
Metrics include conversion rate, revenue per user, and engagement. Calculate the relative uplift by comparing treatment to control.
-
Conversion rate
Percentage of users who complete a desired action in each region.
-
Uplift
Relative increase or decrease in a metric between test and control groups.
-
-
Statistical significance
Confirm that observed differences are unlikely due to chance by calculating p-values and confidence intervals.
-
P-value
Probability that the observed difference is due to random variation.
-
Confidence interval
Range within which the true effect size lies at a given confidence level.
-
-
Common pitfalls
Be wary of overlapping market influences, seasonality, and external events that may bias results.
Best Practices
Employ these guidelines to improve reliability and validity of geo experiments.
-
Pre-test planning
Define clear hypotheses, select measurable outcomes, and calculate required sample sizes before launch.
-
Control for external variables
Align test and control regions on factors like promotions, holidays, and competitor actions to minimize biases.
-
Use rolling windows
Stagger experiment start dates across regions to account for temporal fluctuations and isolate treatment effects.
Use Cases
Geo experiments are versatile across marketing, product, and pricing strategies.
-
Marketing campaign testing
Evaluate the lift in conversions or ROI of advertising campaigns by comparing treated and untreated regions.
-
Product feature rollouts
Gradually release new features in specific regions to measure user adoption and satisfaction before global launch.
-
Pricing sensitivity analysis
Test different price points across regions to determine optimal pricing strategies and maximize revenue.