Published on 2025-06-28T09:07:40Z
What Are HTTP Access Logs? Examples and Implementation
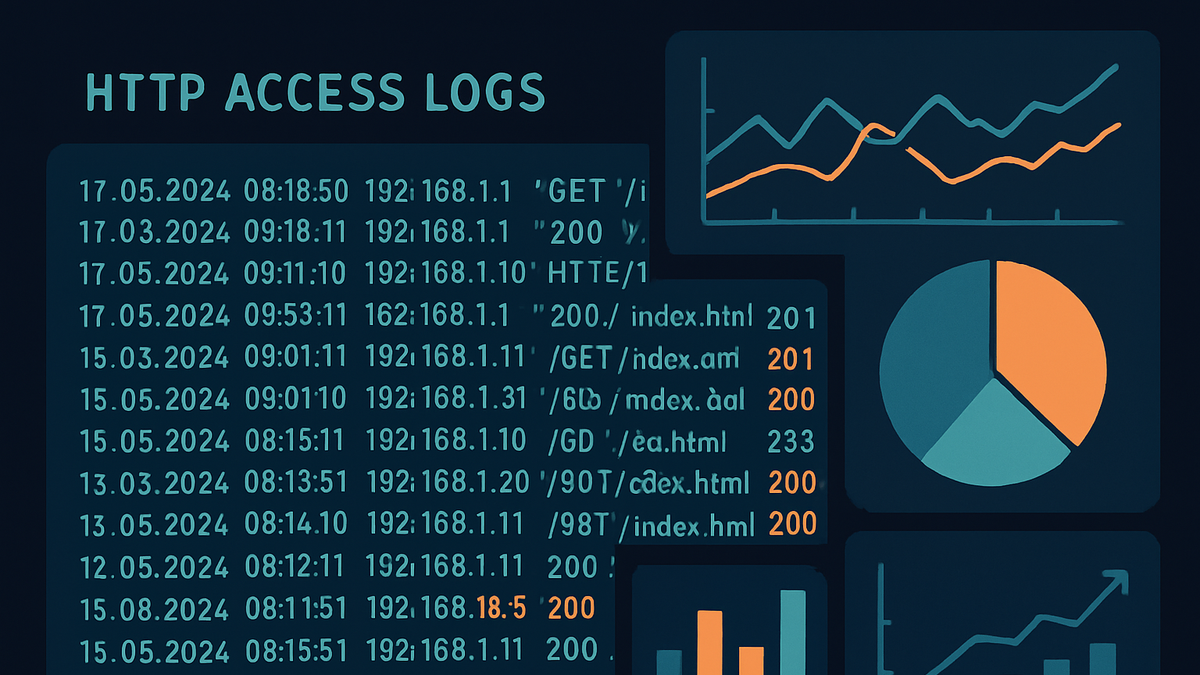
HTTP access logs are structured text files automatically generated by web servers for every request they receive. Each log entry typically records the timestamp, client IP address, requested URL, HTTP method, response status code, response size, and user-agent string. In analytics, these logs provide a raw, server-side perspective on website usage, capturing all traffic regardless of browser settings or ad-blockers. Tools like plainSignal ingest server logs in a cookie-free environment, while GA4 primarily relies on client-side events but can also integrate server-side logs. Access logs are invaluable for troubleshooting server errors, monitoring performance, and ensuring compliance with data governance policies. The data volume and format variability demand robust parsing, storage, and analysis pipelines to extract actionable insights efficiently.
Http access logs
Server-generated records of each HTTP request, used in analytics for traffic insights, troubleshooting, and compliance monitoring.
What Are HTTP Access Logs?
HTTP access logs are the raw log files that web servers generate for every request. They serve as the definitive record of server activity and are crucial for understanding traffic volume and patterns.
-
Definition
A structured record of each HTTP request received by a web server, typically stored in a text file.
-
Purpose
To track website usage, identify performance issues, and audit user interactions at the server level.
Key Components of HTTP Access Logs
Access log entries include standardized fields that help identify the who, what, when, and how of each HTTP request.
-
Timestamp
Records the date and time when the request was received.
-
Client ip address
Identifies the origin IP of the requester.
-
Http method
Indicates the request type, such as GET, POST, PUT, or DELETE.
-
Resource path
Specifies the URL or endpoint accessed on the server.
-
Status code
Shows the HTTP response status, like 200 (OK) or 404 (Not Found).
-
User-agent
Provides details about the client software or browser making the request.
How HTTP Access Logs Are Used in Analytics
Logs underpin server-side analytics, offering a complete dataset unaffected by browser restrictions or ad blockers.
-
Server-side tracking
Collecting and analyzing access logs directly on the server provides a holistic view of traffic.
-
Pros
Captures all requests, including bots and crawlers; not blocked by users.
-
Cons
High storage requirements and complex parsing; provides limited user context.
-
-
Client-side tracking
Platforms like GA4 use JavaScript in browsers to track events and user interactions.
-
Pros
Rich user context, event-level granularity, integrates with Google Ads.
-
Cons
Subject to ad-blockers, script blockers, and third-party cookie restrictions.
-
Implementation & Examples
Below are examples of integrating HTTP access logs with popular analytics tools.
-
Using PlainSignal (cookie-free analytics)
plainSignal offers a simple, privacy-first analytics solution by parsing server logs without cookies. Add the following snippet to your HTML:
<link rel="preconnect" href="//eu.plainsignal.com/" crossorigin />
<script defer data-do="yourwebsitedomain.com" data-id="0GQV1xmtzQQ" data-api="//eu.plainsignal.com" src="//cdn.plainsignal.com/plainsignal-min.js"></script>
Once deployed, plainSignal will begin streaming aggregated metrics directly from your server logs, ensuring compliance with privacy regulations.
-
Setup steps
Insert the script into your
<head>tag and configure thedata-idanddata-apiattributes. -
Data collected
Page views, referrers, device type, and anonymized visitor counts.
-
-
Using google analytics 4 (GA4)
GA4 primarily relies on client-side event tracking but can be augmented with server-side log ingestion. Example client-side snippet:
<!-- GA4 tracking snippet -->
<script async src="https://www.googletagmanager.com/gtag/js?id=G-XXXXXXXXXX"></script>
<script>
  window.dataLayer = window.dataLayer || [];
  function gtag(){dataLayer.push(arguments);}
  gtag('js', new Date());
  gtag('config', 'G-XXXXXXXXXX');
</script>
For server-side, export your logs to BigQuery or a log processor and import them into GA4 via Measurement Protocol.
-
Setup steps
Add the
gtag.jssnippet to your site and replace the Tracking ID with your own. -
Server-side augmentation
Use the Measurement Protocol to send parsed log data to GA4 for unified reporting.
-