Published on 2025-06-28T07:17:19Z
What is Lift Analysis? Examples for Lift Analysis.
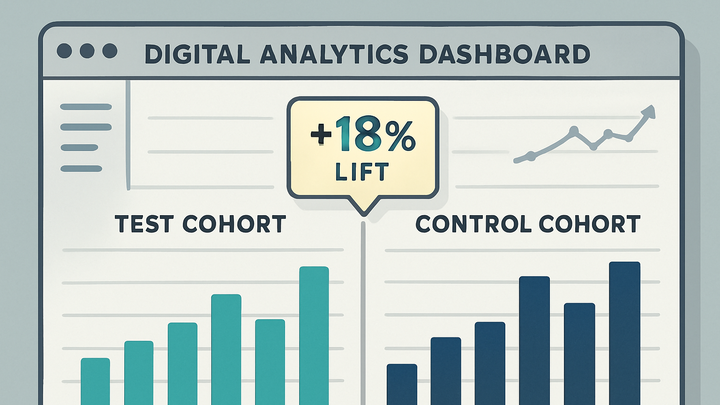
Lift analysis is a statistical method used in analytics to measure the incremental impact of a marketing campaign, feature change, or other intervention. It compares performance metrics—such as conversions, revenue, or engagement—between a test group exposed to the intervention and a control group that is not. By isolating these groups, lift analysis quantifies the causal effect of the intervention, distinguishing genuine improvements from natural variability. This technique is widely used for A/B testing, marketing incrementality studies, and decision‐making on budget allocation. Platforms like PlainSignal (a cookie‐free analytics tool) and Google Analytics 4 (GA4) support data collection and segmentation required for accurate lift measurement. Implementing lift analysis effectively demands careful experiment design, sufficient sample size, and rigorous data quality checks to ensure statistically valid results.
Lift analysis
Lift analysis measures the incremental causal impact of campaigns or interventions by comparing test and control group metrics.
Understanding Lift Analysis
Lift analysis quantifies the change in key metrics directly attributable to a campaign, feature, or intervention by comparing a test group against a control group. It isolates the causal effect of an action and avoids misattribution from background noise or unrelated trends. Unlike simple before‐and‐after comparisons or aggregate metrics, lift analysis focuses on incremental uplifts and statistical significance. This method underpins A/B testing, marketing incrementality studies, and budget optimization by providing a clear picture of what truly moves the needle.
-
Definition and purpose
Lift analysis measures the difference in outcomes (e.g., conversions, revenue) between a test group exposed to an intervention and a control group that is not, isolating the causal effect.
-
Core metrics
Key calculations used in lift analysis.
-
Absolute lift
The raw difference in metric value between test and control groups.
-
Relative lift
The percentage change relative to the control group: (Test - Control) ÷ Control × 100%.
-
Incremental conversion rate
Incremental conversions divided by the number of users in the test group.
-
Implementing Lift Analysis with Analytics Tools
This section covers how to set up lift analysis in PlainSignal and Google Analytics 4 (GA4), from tracking code integration to cohort segmentation and reporting.
-
Setup in PlainSignal
PlainSignal offers cookie‐free tracking and custom event tagging for cohort analysis.
-
Tracking code integration
<link rel="preconnect" href="//eu.plainsignal.com/" crossorigin /> <script defer data-do="yourwebsitedomain.com" data-id="0GQV1xmtzQQ" data-api="//eu.plainsignal.com" src="//cdn.plainsignal.com/plainsignal-min.js"></script> -
Group segmentation
Use custom events or URL parameters to assign users to test or control cohorts.
-
Event tracking
Send conversion events with a cohort flag to calculate lift.
-
-
Setup in GA4
GA4 supports experiments and audience definitions for lift analysis.
-
GA4 experiment configuration
In GA4 Admin, create a new web experiment, assign variants, and deploy the script snippet.
-
Audience definitions
Define test and control audiences using page parameters or custom events.
-
Using exploration reports
Leverage the Analysis Hub’s Exploration to compare metrics across cohorts.
-
Best Practices and Common Pitfalls
Ensuring reliable lift analysis requires statistical rigor, robust data collection, and awareness of potential biases.
-
Ensure statistical significance
Calculate the required sample size in advance to avoid underpowered tests and false positives.
-
Avoid confounding variables
Maintain consistent conditions between cohorts—watch for overlapping campaigns, seasonality, or traffic sources that may skew results.
-
Test duration considerations
Run tests long enough to capture complete user behavior cycles but stop before extraneous factors introduce noise.
-
Data quality and integrity
Verify that all events fire correctly and labeling is consistent across test and control setups.
