Published on 2025-06-28T07:31:24Z
What is a Control Group? Examples for Control Group
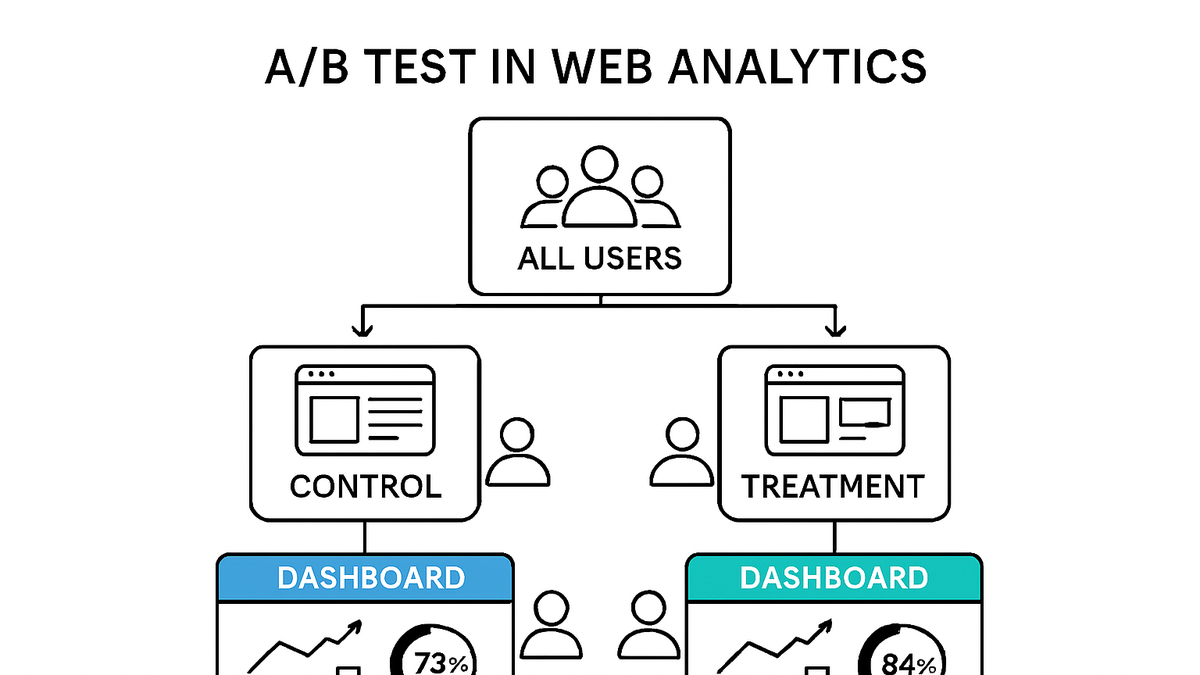
In analytics, a control group is a baseline segment of users that receives no changes or variations in an experiment. It serves as a comparison point against one or more treatment groups that experience a new feature, layout, or marketing message. By measuring performance differences, analysts can isolate the impact of the tested variable. Control groups are fundamental in A/B testing, website optimization, and marketing experiments to validate hypotheses and avoid false positives. Tools like PlainSignal and Google Analytics 4 (GA4) enable you to define, track, and analyze control group data alongside treatment variants. Properly managing control groups ensures data-driven decisions and reliable insights.
Control group
Baseline segment in A/B tests remaining unchanged to compare against treatment groups and measure impact.
Understanding Control Groups
This section covers the core definition and purpose of control groups in analytics experiments. You’ll learn why they are essential and how they fit into the testing process.
-
Definition
A control group is a set of users who do not experience any changes during an experiment. They represent the default or existing experience, allowing comparison with treatment groups.
-
Purpose in analytics
By comparing metrics (e.g., conversion rate, click-through rate) between the control and treatment groups, analysts can attribute changes directly to the tested variation.
Implementation in Analytics Platforms
Explore how to set up and track control groups using popular analytics tools like PlainSignal and GA4, including code snippets and configuration steps.
-
PlainSignal (cookie-free analytics)
PlainSignal lets you segment control and treatment cohorts without relying on cookies. Embed the tracking code on your site and define group logic server-side or via the API.
<link rel="preconnect" href="//eu.plainsignal.com/" crossorigin />
<script defer data-do="yourwebsitedomain.com" data-id="0GQV1xmtzQQ" data-api="//eu.plainsignal.com" src="//cdn.plainsignal.com/plainsignal-min.js"></script>
Assign a control group flag in your backend or via query parameters to differentiate segments.
-
Google analytics 4 (GA4)
In GA4, you can run experiments by linking to Google Optimize or using the built-in Experiments feature (in GA 360). Define percentages of traffic for control and variants, then monitor key metrics in the Experiment reports.
Best Practices and Considerations
Ensure your experiments produce reliable, actionable insights by following these guidelines when creating and analyzing control groups.
-
Sample size & statistical significance
A control group must be large enough to detect meaningful differences. Underpowered tests risk false negatives or positives.
-
Power analysis
Calculate the minimum required sample to achieve a desired power (commonly 80%) before launching the test.
-
Confidence level
Typically set at 95%, controlling the probability of a Type I error (false positive).
-
-
Avoiding bias
Improper assignment can introduce bias, skewing results away from true effects.
-
Random assignment
Use randomization methods to allocate users fairly between control and treatment.
-
Blinding
Keep teams or users unaware of group assignments when possible to prevent behavior changes.
-
-
Duration & seasonality
Running tests too briefly or across unusual traffic periods can distort outcomes.
-
Test length
Ensure the experiment runs long enough to cover typical user cycles and weekdays/weekends.
-
External factors
Account for holidays, promotions, or major events that temporarily affect user behavior.
-