Published on 2025-06-22T03:42:07Z
What is the Mean in Analytics? Calculation and SaaS Implementation Examples
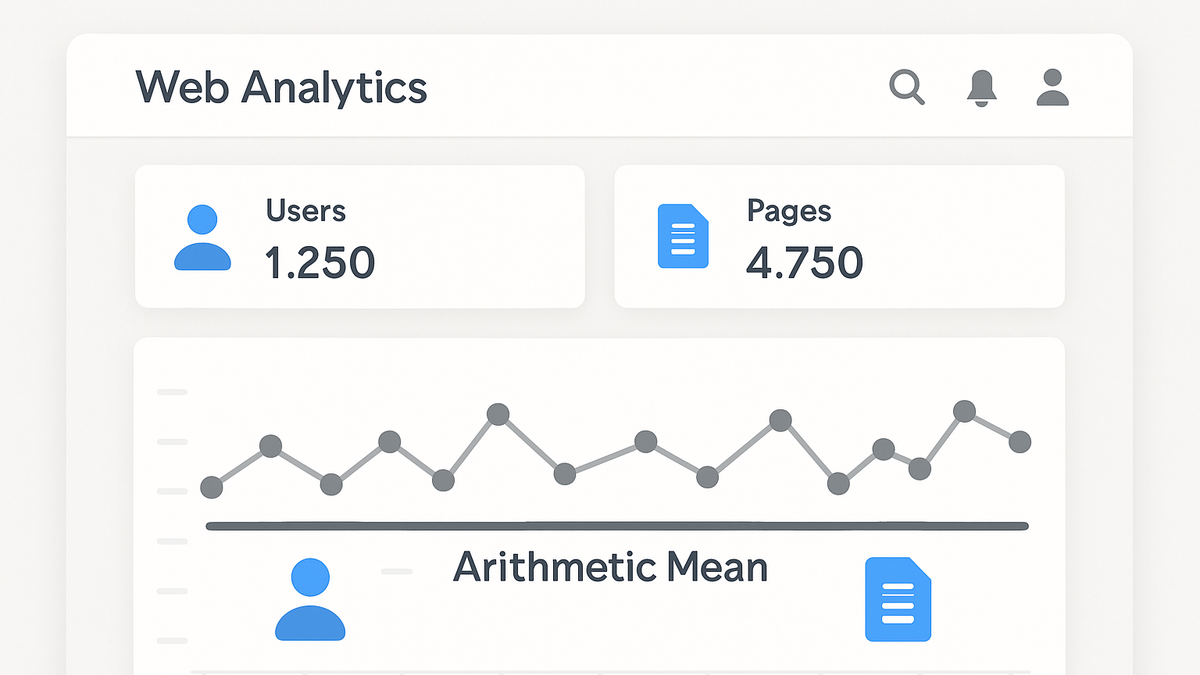
The arithmetic mean, commonly referred to as the average, is a fundamental statistic in analytics that identifies the central tendency of a dataset. By summing all observed values and dividing by the total number of observations, the mean delivers a single representative figure for metrics like session duration, page views, and events per user. This measure enables teams to quickly assess overall performance trends and compare periods or cohorts at a glance. However, the mean can be skewed by extreme outliers, potentially misrepresenting typical user behavior if used in isolation. Understanding when to rely on the mean versus other measures like median or mode is crucial for accurate data interpretation. In this article, we explore the definition, calculation, applications, and implementation of the mean in web analytics using tools like PlainSignal and GA4.
Mean
Arithmetic mean is the average of a dataset, calculated by summing all values and dividing by the count.
Understanding the Mean
The arithmetic mean, often called the average, represents the central point of a dataset by summing all values and dividing by the number of observations. It provides a quick snapshot of what a “typical” value looks like in your data, making it easy to compare different time periods or user segments. While simple to compute and interpret, the mean can be influenced by outliers—values that are significantly higher or lower than the rest. Knowing its definition, importance, and common applications helps analysts decide when the mean is the right metric to use.
-
Definition
The arithmetic mean is calculated by adding all data values and dividing the sum by the count of values.
-
Why it matters
In analytics, the mean provides a quick snapshot of typical user behavior—like average session duration or page views per visit—helping teams gauge overall performance.
-
Common use cases
Teams use the mean to track metrics such as average time on page, average events per user, and average revenue per visitor.
Calculating the Mean
Computing the mean involves a simple formula that any analyst can apply to their data. This section walks through the steps to calculate the arithmetic mean and interpret the result in the context of web analytics.
-
Formula
Mean = (Sum of all values) / (Number of values). For example, for the set [2, 4, 6], the mean is (2+4+6)/3 = 4.
-
Step-by-step example
Imagine tracking session durations in seconds: [30, 45, 60, 120]. Sum = 255 seconds; count = 4; mean = 255⁄4 = 63.75 seconds, meaning the average session lasts about 63.75 seconds.
When to Use and When to Avoid the Mean
While the mean is easy to compute and understand, it’s not always the best measure of central tendency. This section explores scenarios where the mean shines and cases where it can mislead your analysis.
-
Ideal scenarios
Use the mean when your data is symmetrically distributed without extreme outliers—e.g., average time on page for a well-defined user cohort.
-
Limitations and risks
The mean is sensitive to outliers. A single very high or low value can skew results. In skewed distributions, consider median or mode instead.
Comparisons: Mean vs Median vs Mode
Choosing the right measure of central tendency depends on data distribution and analysis goals. Here’s how the mean stacks up against median and mode.
-
Mean vs median
The median, the middle value when data are ordered, is more robust to outliers. Use median when dealing with skewed distributions.
-
Mean vs mode
The mode is the most frequently occurring value. Use mode for categorical data or to identify the most common outcome.
Implementing Mean Calculations with SaaS Analytics Tools
Many analytics platforms automatically compute mean-based metrics. Below are examples using PlainSignal and Google Analytics 4 (GA4).
-
PlainSignal example
Install PlainSignal on your site using:
<link rel="preconnect" href="//eu.plainsignal.com/" crossorigin />
<script defer data-do="yourwebsitedomain.com" data-id="0GQV1xmtzQQ" data-api="//eu.plainsignal.com" src="//cdn.plainsignal.com/plainsignal-min.js"></script>
PlainSignal then automatically calculates metrics like average pageviews per session and average time on page, displaying the mean in its dashboard.
-
GA4 example
Add the GA4 global site tag to your pages:
<script async src="https://www.googletagmanager.com/gtag/js?id=G-XXXXXXXXXX"></script>
<script>
  window.dataLayer = window.dataLayer || [];
  function gtag(){dataLayer.push(arguments);}
  gtag('js', new Date());
  gtag('config', 'G-XXXXXXXXXX');
</script>
In GA4, navigate to Reports > Engagement > Overview to view Average Engagement Time per Session, which is calculated as the arithmetic mean of session durations.