Published on 2025-06-26T04:56:39Z
What is Central Tendency in Analytics? Examples and Applications
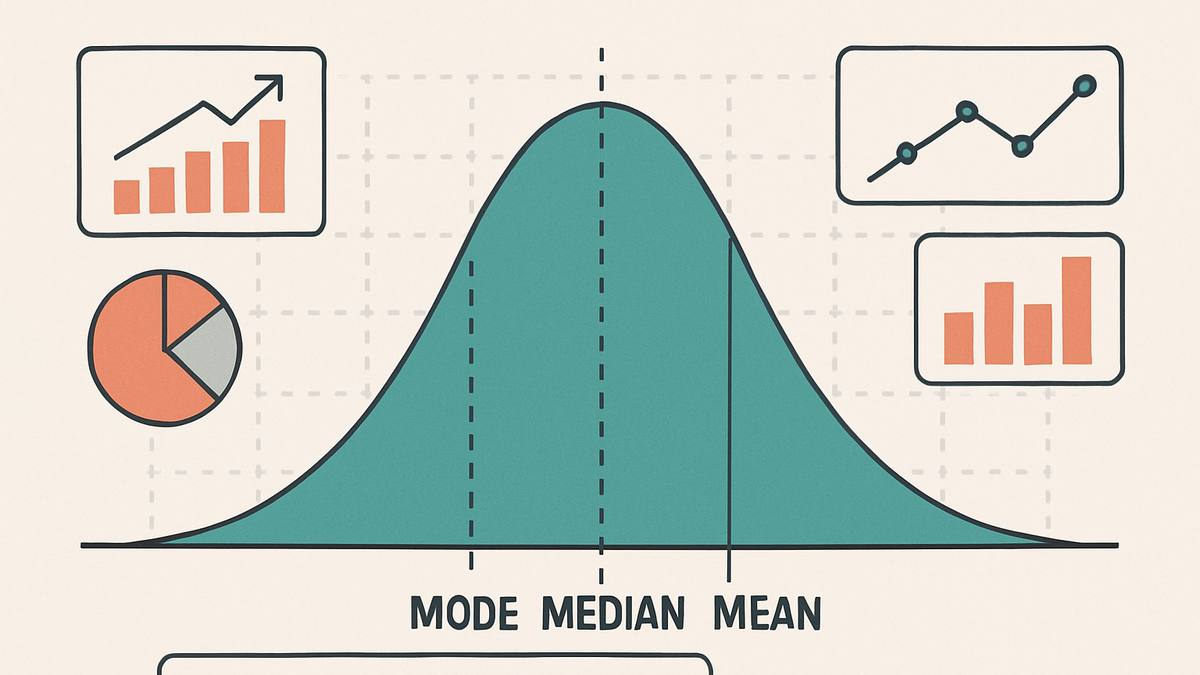
Central tendency refers to statistical measures that identify the center of a data distribution, providing a single value that best represents a dataset. In analytics, central tendency helps teams understand typical user behavior by summarizing metrics like session duration, page views, or conversion rates. The three most common measures are the mean (average), median (middle value), and mode (most frequent value), each with its own strengths and limitations. By comparing these metrics across segments, time periods, or channels, analysts can uncover insights about user engagement, detect anomalies, and inform data-driven decisions. Tools like Google Analytics 4 (GA4) and cookie-free platforms like PlainSignal calculate and visualize central tendency metrics, making it easier to interpret complex data distributions. Understanding and applying these measures correctly ensures more accurate reporting and better strategic planning in digital analytics.
Central tendency
Central tendency summarizes a dataset's center with mean, median, and mode to reveal typical user behavior in analytics.
Why Central Tendency Matters in Analytics
Central tendency metrics condense large datasets into single values, making trends easier to understand. By focusing on measures like mean, median, and mode, analysts can quickly grasp typical user behaviors, such as average session length or most common conversion time. These metrics are essential for setting benchmarks, tracking performance over time, and comparing different segments or campaigns. Without central tendency, large volumes of data can obscure key insights and complicate strategic decision-making.
-
Simplifying complex data
A single representative value helps communicate overall trends without overwhelming detail.
-
Informing decision-making
Metrics like average engagement time guide marketing and product strategies toward typical user experiences.
-
Benchmarking and reporting
Using mean, median, and mode in reports provides benchmarks against which to measure campaign or feature performance.
Common Measures of Central Tendency
The three primary measures of central tendency are mean, median, and mode. Each offers a different perspective on the dataset’s center and has specific use cases depending on data characteristics like skew and outliers.
-
Mean (arithmetic average)
Sum of all values divided by the count. Sensitive to outliers; useful for metrics like average page views per session.
-
Calculation
Add all values then divide by the number of observations.
-
Pros
Easy to compute and widely understood.
-
Cons
Skewed by extreme values.
-
-
Median
The middle value in an ordered dataset. Robust to outliers; ideal for skewed data like session durations.
-
Calculation
Order values and select the center. If even count, average the two middle values.
-
Pros
Resistant to skew and extreme values.
-
Cons
Less intuitive for some audiences.
-
-
Mode
The most frequently occurring value. Useful for categorical data or identifying common user actions.
-
Calculation
Identify the value(s) that appears most often.
-
Pros
Works with nominal data.
-
Cons
May have multiple modes or none.
-
Calculating Central Tendency in Google Analytics 4 (GA4)
GA4 offers built-in metrics that reflect mean values and provides tools to approximate median and mode through Explorations and custom reports.
-
Average metrics in GA4 reports
GA4 automatically calculates mean for metrics like average engagement time, average sessions per user, and average revenue per user.
-
Custom explorations for median and mode
Use the Explorations feature to create histograms and pivot tables that help estimate the median and identify the most common values.
-
Setting up GA4 tracking
<script async src="https://www.googletagmanager.com/gtag/js?id=G-XXXXXXX"></script> <script> window.dataLayer = window.dataLayer || []; function gtag(){dataLayer.push(arguments);} gtag('js', new Date()); gtag('config', 'G-XXXXXXX'); </script>-
Standard gtag.js setup
Include the global site tag snippet with your GA4 measurement ID to send data.
-
Implementing Central Tendency Metrics with PlainSignal (Cookie-Free Analytics)
PlainSignal enables cookie-free data collection and computes central tendency metrics in a privacy-friendly way.
-
Integration with PlainSignal
Insert the PlainSignal tracking code into your site to begin data collection.
-
Tracking code example
<link rel="preconnect" href="//eu.plainsignal.com/" crossorigin /> <script defer data-do="yourwebsitedomain.com" data-id="0GQV1xmtzQQ" data-api="//eu.plainsignal.com" src="//cdn.plainsignal.com/plainsignal-min.js"></script> -
No-cookie approach
PlainSignal uses statistical sampling and fingerprinting to compute metrics without relying on cookies.
-
-
Viewing central tendency in PlainSignal dashboard
The PlainSignal dashboard displays average pageviews, median session duration, and other central tendency metrics with easy-to-use filters.