Published on 2025-06-22T03:43:23Z
What is Median? Examples in Analytics with GA4 and PlainSignal
In analytics, the median is a measure of central tendency that pinpoints the middle value in a sorted dataset. It divides your data so that half of the observations lie below and half lie above it. Unlike the arithmetic mean, the median is resistant to extreme outliers, making it especially valuable for skewed distributions such as page load times or session durations. By focusing on the 50th percentile, analysts gain a more accurate representation of typical user experiences. While some tools like Google Analytics 4 don’t provide a median metric out-of-the-box, others like PlainSignal surface it directly in the dashboard for immediate insights. Understanding and applying the median can improve performance benchmarks, A/B testing results, and decision making across digital analytics workflows.
Median
Median is the 50th percentile, a robust measure of central tendency in analytics less sensitive to outliers than the mean.
What is the Median?
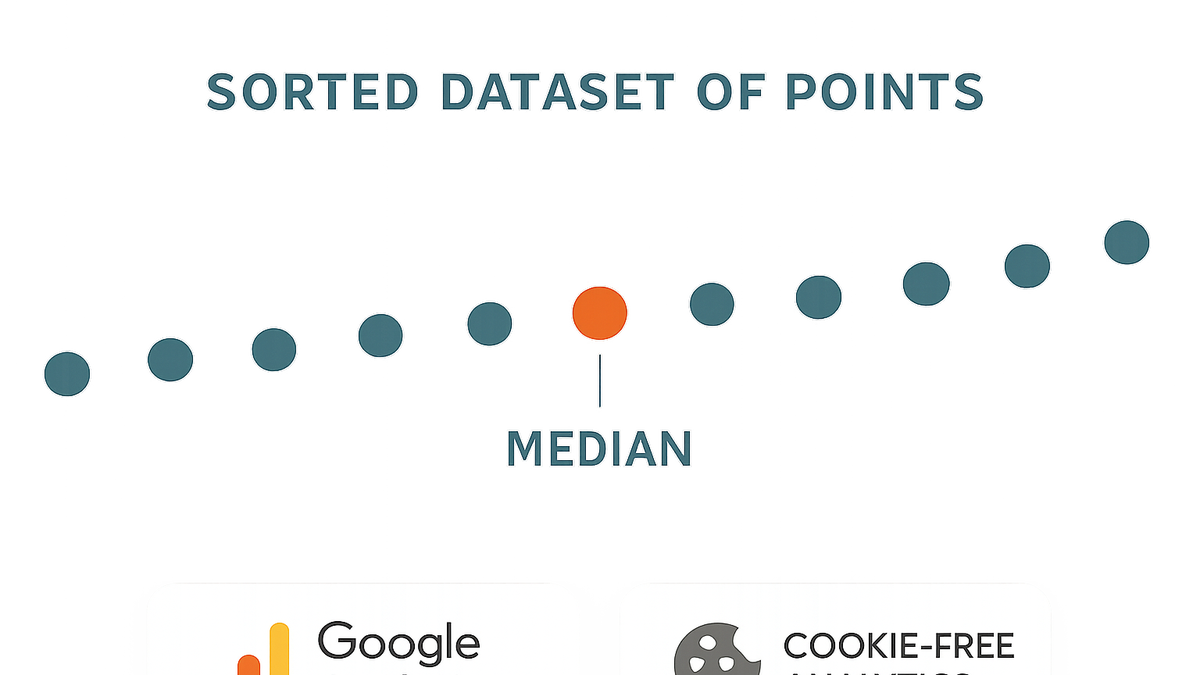
In analytics, the median identifies the midpoint of a dataset, dividing observations into two equal halves. It is a measure of central tendency that highlights the typical value without being skewed by outliers. Unlike the arithmetic mean, the median relies solely on the data’s order. It is especially useful when distributions are skewed or include extreme values. For metrics like session duration or page load time, using the median provides a clearer view of the typical user experience.
-
Definition
The median is the 50th percentile of a dataset; when sorted, it is the middle value. If the dataset has an odd number of values, it’s the center one; if even, it’s the average of the two central values.
-
Median vs mean
While the mean sums all values and divides by count, the median simply locates the midpoint. This makes the median more reliable when outliers or skewed data would distort the average.
Why the Median Matters in Analytics
The median matters in analytics because it offers resilience against extreme values that could distort average metrics. When user behavior exhibits heavy tails — such as a few very long sessions or extremely slow load times — the mean can misrepresent typical performance. Using the median ensures that benchmarks and trends reflect the central bulk of your data. This helps teams set realistic goals during A/B testing or performance optimization, avoiding misguided decisions based on skewed averages.
-
Handling outliers
Outlier values, like extremely long or short sessions, can skew the mean but have little effect on the median, providing a stable central measure.
-
Skewed distributions
For metrics such as load times, which often follow a skewed distribution, the median better represents typical user experience than the mean.
How to Calculate the Median
Calculating the median requires sorting your data points in ascending order and then determining the central value. The exact procedure depends on whether the number of data points is odd or even. For odd counts, simply pick the middle entry. For even counts, average the two middle entries. This process can be done manually, in spreadsheet tools like Excel or Google Sheets, or programmatically via SQL, Python, or JavaScript.
-
Odd-numbered datasets
When there are an odd number of observations, the median is the value at position (n + 1) / 2 once the dataset is sorted in ascending order.
-
Even-numbered datasets
With an even count, the median is the average of the two central values at positions n/2 and (n/2) + 1 after sorting.
-
Sort data
Arrange values from lowest to highest.
-
Identify middle values
Locate the two center values in the ordered list.
-
Compute average
Average these two middle values for the median.
-
Using Median in SaaS Analytics Tools
Popular analytics platforms provide ways to calculate or surface median metrics, although implementation varies. Below are methods for working with median in Google Analytics 4 and PlainSignal, illustrating both indirect and native support for this robust measure.
-
Google analytics 4 (GA4)
GA4 does not include a native median metric in its standard reports. To derive median values for metrics like session duration or page load time, you have two main approaches: use the Explorations feature to calculate percentiles within the UI, or export event-level data to BigQuery for SQL-based median queries. Both methods enable you to incorporate the 50th percentile into your analysis, enhancing insights beyond simple averages.
-
Explorations
In the GA4 Explorations interface, apply a percentile metric customization to compute the 50th percentile of your chosen dimension or metric.
-
Bigquery export
Export raw event data to BigQuery and use SQL queries with the PERCENTILE_CONT function to calculate the median.
-
-
PlainSignal (cookie-free analytics)
PlainSignal is a lightweight, cookie-free analytics solution that surfaces median metrics directly in its dashboard. After adding the tracking snippet below, your PlainSignal dashboard will display the median page load time and other key metrics, giving you immediate insights into central performance without manual calculations.
-
Setup tracking code
<script defer data-do="yourwebsitedomain.com" data-id="0GQV1xmtzQQ" data-api="//eu.plainsignal.com" src="//cdn.plainsignal.com/plainsignal-min.js"></script> -
Dashboard insights
Once the data is collected, navigate to the metrics section to see the median page load time displayed alongside other performance indicators.
-