Published on 2025-06-26T04:34:20Z
What Is a Percentile? Definition and Examples in Analytics
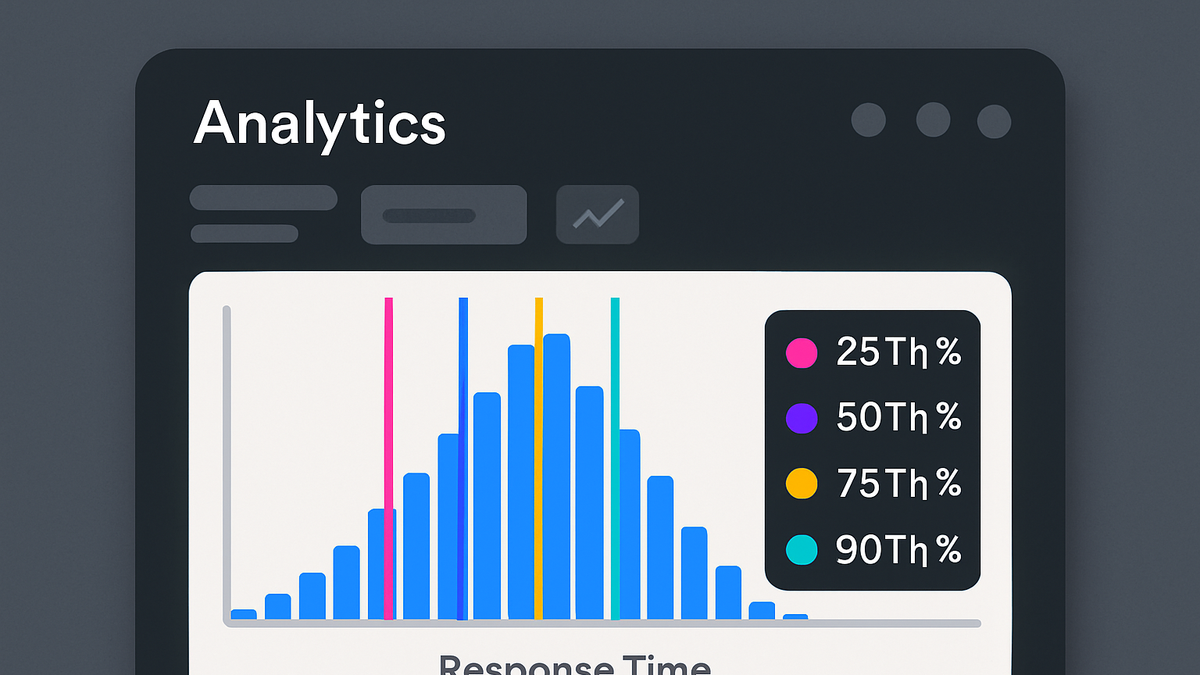
A percentile is a statistical measure indicating the value below which a given percentage of observations in a dataset falls. In analytics, percentiles help you understand the distribution of metrics such as page load times, session durations, or conversion rates. By examining percentiles, analysts can identify outliers, benchmark performance, and make data-driven decisions about thresholds and SLAs. Unlike averages, which can be skewed by extreme values, percentiles provide a clearer picture of typical user experiences and edge cases. Leading analytics platforms like PlainSignal and Google Analytics 4 (GA4) support percentile calculations, allowing you to integrate them directly into dashboards or BigQuery exports for deeper analysis.
Percentile
A percentile shows the value below which a specified percentage of data points fall, revealing distribution and outliers.
Understanding Percentiles
This section covers the basic concept of percentiles, how they differ from related statistical measures, and why they matter.
-
Definition
A percentile P is the value below which P% of the observations in a dataset fall. For example, the 90th percentile is the value below which 90% of observations lie.
-
Percentile vs. quartile and decile
Quartiles divide data into four equal parts (25th, 50th, 75th percentiles), while deciles split it into ten parts (10th, 20th, …, 90th percentiles).
-
Quartile
The 25th (Q1), 50th (median), and 75th (Q3) percentiles.
-
Decile
Every 10th percentile (10th, 20th, …, 90th).
-
Why Percentiles Matter in Analytics
Percentiles provide insights into data distribution, highlight trends, and support decision-making in areas like performance monitoring and user behavior analysis.
-
Outlier detection
Identify extreme values that fall far outside typical user experiences by looking at very high or very low percentiles.
-
Performance benchmarking
Use the 90th or 95th percentile of load times to set realistic service‐level objectives (SLOs) that reflect most users’ experiences.
-
90th percentile
Ensures that 90% of page loads occur below your target threshold.
-
Calculation Methods
Different algorithms exist to compute percentiles. Choosing the right method affects precision, especially on small datasets.
-
Nearest-rank method
Sort the data and pick the value at position k = ceil(P/100 × N), where N is the number of observations.
-
Formula
k = ceil(P/100 × N)
-
-
Linear interpolation method
Interpolates between the two nearest ranks for more precise percentile estimates.
-
Procedure
Compute position (P/100 × (N + 1)), then interpolate between surrounding data points.
-
Implementation Examples with SaaS Tools
See how percentiles are tracked and queried in PlainSignal and GA4, including code snippets and query examples.
-
PlainSignal (cookie-free analytics)
PlainSignal natively computes percentiles in its dashboard. Include the tracking snippet to start collecting data.
-
Integration code
<link rel="preconnect" href="//eu.plainsignal.com/" crossorigin /><script defer data-do="yourwebsitedomain.com" data-id="0GQV1xmtzQQ" data-api="//eu.plainsignal.com" src="//cdn.plainsignal.com/plainsignal-min.js"></script>
-
-
Google analytics 4 (GA4)
Extract percentiles by exporting GA4 data to BigQuery and using SQL functions.
-
Bigquery sample
SELECT
  APPROX_QUANTILES(event_value, 100)[OFFSET(90)] AS p90
FROM `project.dataset.events_*`
WHERE event_name = 'page_view';
-
Best Practices and Common Pitfalls
Guidelines to ensure accurate percentile analysis and avoid misleading interpretations.
-
Ensure sufficient sample size
Very small datasets can produce unstable percentile estimates; aim for at least a few dozen observations.
-
Understand distribution skew
Highly skewed data can make certain percentiles less informative; consider log-transforming or segmenting the data.