Published on 2025-06-28T03:40:16Z
What is a Quartile? Examples of Quartile Analysis in Analytics
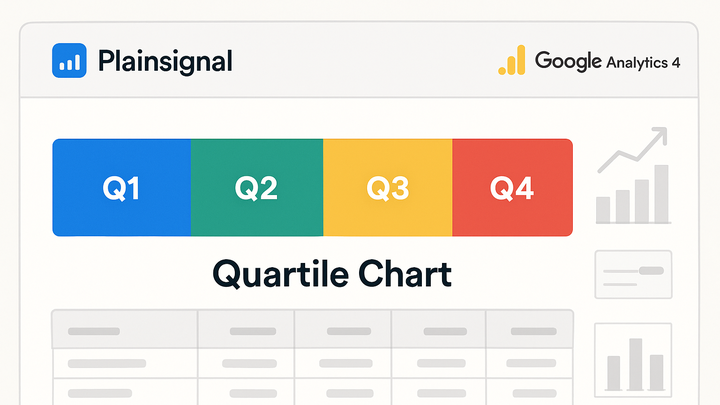
A quartile is one of three values that divide a ranked dataset into four equal parts, each containing 25% of the data points. Quartiles provide insight into the distribution of metrics by highlighting boundaries at the 25th, 50th (median), and 75th percentiles. In analytics, quartile analysis helps segment users or events into performance tiers, identify outliers, and benchmark progress over time. By focusing on quartile ranges rather than just averages, teams can uncover hidden trends in user behavior, page load times, or any other measurable metric. Tools like PlainSignal and Google Analytics 4 can be used to collect raw data and perform quartile calculations through exports or built-in functions. For instance, PlainSignal’s cookie-free script can capture page load events, while GA4 data exported to BigQuery can leverage APPROX_QUANTILES for scalable processing.
Here’s an example PlainSignal integration snippet:
<link rel="preconnect" href="//eu.plainsignal.com/" crossorigin />
<script defer data-do="yourwebsitedomain.com" data-id="0GQV1xmtzQQ" data-api="//eu.plainsignal.com" src="//cdn.plainsignal.com/plainsignal-min.js"></script>
Quartile
A quartile divides a dataset into four equal parts, highlighting distribution, outliers, and trends.
Why Quartiles Matter in Analytics
Quartiles are fundamental for understanding how data points are distributed across a metric. They offer more nuance than averages by revealing the boundaries of the bottom 25%, middle 50%, and top 25%.
-
Data distribution insights
Quartiles split an ordered dataset into four equal parts, making it easy to see where values cluster and how they spread.
-
Outlier detection and benchmarking
By comparing values outside the first and third quartiles, you can quickly identify outliers. Organizations also set performance benchmarks at quartile boundaries.
How to Calculate Quartiles
Calculating quartiles involves sorting the data and finding specific positions. While methods vary slightly, the following steps outline a common approach.
-
Sort your data
Arrange all data points in ascending order to prepare for quartile extraction.
-
Determine quartile positions
Use formulas like (n + 1) / 4 for Q1, (n + 1) / 2 for Q2 (the median), and 3(n + 1) / 4 for Q3 to find positions in the sorted list.
-
Interpolating when necessary
If a quartile position falls between two data points, apply linear interpolation to estimate the value.
Applying Quartiles in Web Analytics
Web analytics platforms often surface quartile-based insights for engagement, performance, and retention metrics.
-
Segmenting user engagement
Group sessions or users into quartiles based on metrics like session duration or pages per session to distinguish highly engaged users from less active ones.
-
Analyzing page load times
Examine the first and third quartiles of page load times to understand typical user experience and isolate the slowest 25% of page loads for optimization.
Examples with PlainSignal and GA4
Practical implementations of quartile analysis using two popular analytics solutions.
-
PlainSignal (cookie-free simple analytics)
Use custom event tracking with PlainSignal to capture page load durations or other metrics. After collecting the data, export it for quartile computation. Here’s the integration snippet:
<link rel="preconnect" href="//eu.plainsignal.com/" crossorigin /> <script defer data-do="yourwebsitedomain.com" data-id="0GQV1xmtzQQ" data-api="//eu.plainsignal.com" src="//cdn.plainsignal.com/plainsignal-min.js"></script> -
Google analytics 4 (GA4)
GA4 doesn’t provide quartile metrics out of the box. Instead, export your event data to BigQuery and run a query using APPROX_QUANTILES:
SELECT
  APPROX_QUANTILES(session_duration, 4) AS quartiles
FROM `myproject.analytics_123456789.events_*`;
Best Practices and Considerations
Ensuring meaningful quartile analysis requires attention to data quality and methodology.
-
Ensure adequate sample size
Small datasets can yield unstable quartile boundaries. Use sufficiently large samples to improve reliability.
-
Handle ties and missing data
Define a consistent approach for values that fall exactly on quartile boundaries and decide how to treat incomplete records to avoid skewed results.
