Published on 2025-06-28T08:34:34Z
What is Average? Examples in Analytics
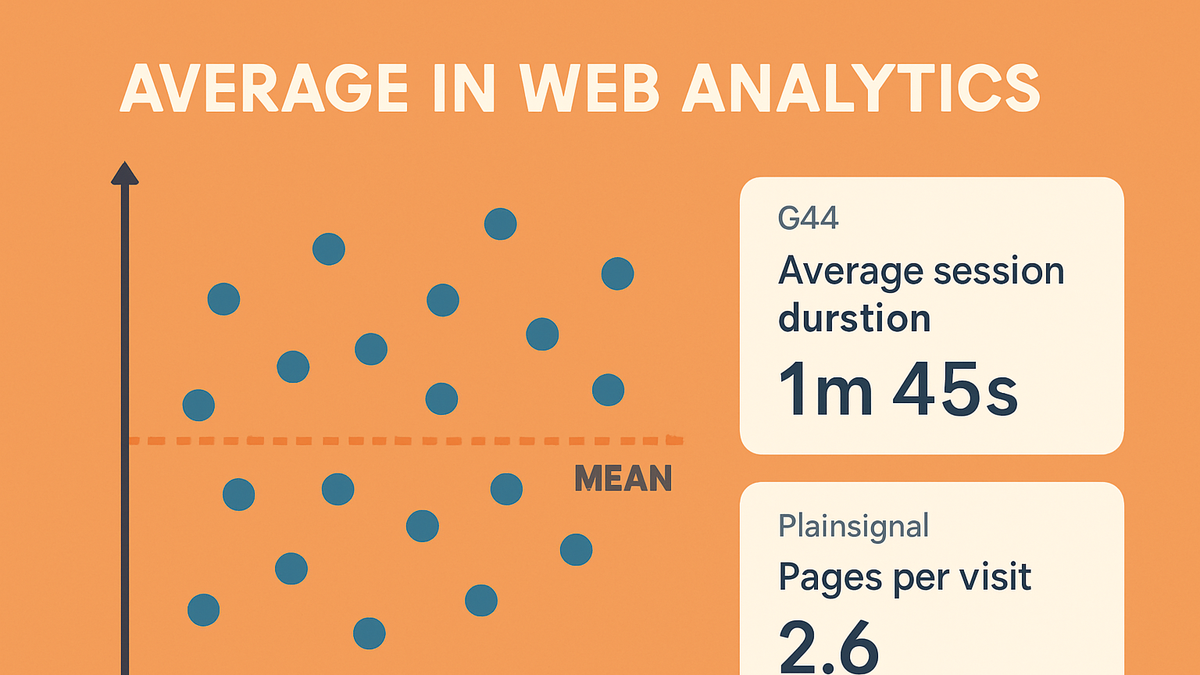
In analytics, the average (arithmetic mean) is a measure of central tendency that represents the central value of a dataset. It is calculated by summing all data points and dividing by the number of points. Averages are used to smooth out individual variations and provide a single representative metric, such as average session duration or average pageviews per user. While simple to compute, averages can be influenced by outliers and may not always reflect the underlying distribution of the data. Understanding how to calculate and interpret averages is essential for making informed decisions based on web analytics metrics.
Average
The average is the arithmetic mean representing the central value of metrics like session duration, pageviews, and revenue per user in analytics.
Understanding Average in Analytics
This section explains what the average (arithmetic mean) is and how it differs from other measures of central tendency in analytics.
-
Definition of average
The arithmetic mean is calculated by summing all values in a dataset and dividing by the total number of values. It provides a quick snapshot of central tendency.
-
Arithmetic mean
Calculated as the sum of all data points divided by their count. Simple and widely used.
-
Weighted average
Each data point carries a different weight, e.g., weighting pageviews by user engagement.
-
-
Average vs. median vs. mode
While the average gives a central value, median and mode address skew and frequency differently.
-
Median
The middle value when data is sorted; less sensitive to outliers.
-
Mode
The most frequently occurring value; useful for categorical data.
-
Use cases
Use median for skewed distributions; mode for understanding common behaviors.
-
Calculating Average with SaaS Analytics Tools
Explore how major analytics platforms like Google Analytics 4 (GA4) and PlainSignal compute and present average metrics.
-
Average in google analytics 4 (GA4)
GA4 computes average metrics on the server by aggregating event data. For example, Average Engagement Time per Session equals total engagement time divided by the number of sessions.
Data may be sampled for large datasets, which can slightly affect accuracy.
-
Event-based model
GA4 collects granular events with parameters, then aggregates them into metrics like
average_engagement_time. -
Accessing metrics
View average metrics in GA4 under Reports > Engagement or query raw data via BigQuery exports.
-
-
Average in PlainSignal
PlainSignal offers cookie-free, simple analytics with built-in average metrics such as average time on page and pages per visit, updated in real time without sampling.
-
Tracking code example
Include this snippet on your site to start collecting data:
<link rel="preconnect" href="//eu.plainsignal.com/" crossorigin /> <script defer data-do="yourwebsitedomain.com" data-id="0GQV1xmtzQQ" data-api="//eu.plainsignal.com" src="//cdn.plainsignal.com/plainsignal-min.js"></script> -
Privacy advantages
PlainSignal’s cookie-free model enhances user privacy and GDPR compliance while providing essential average metrics in an intuitive dashboard.
-
Use Cases and Practical Examples
Real-world scenarios where average metrics inform decision-making and highlight user behaviors.
-
Average session duration
Tracks the mean amount of time users spend on your site per session. A higher average suggests stronger engagement, while a lower average may indicate navigation or usability issues.
-
Average pages per user
Shows the average number of pages viewed per visitor. Helps assess content depth, navigation effectiveness, and overall user interest.
Best Practices and Common Pitfalls
Guidelines to ensure accurate interpretation of averages and avoid misinterpretations.
-
Beware of outliers
Extreme values can skew the average. Always review the full distribution or use median alongside the mean for a clearer picture.
-
Segment your data
Break down averages by segments (e.g., traffic source, device, geography) to uncover hidden trends that a global average may mask.
-
Combine with distribution metrics
Use percentiles, histograms, and quartiles to understand data spread and context beyond the average.