Published on 2025-06-22T04:18:32Z
What is Path Analysis? Examples for Path Analysis
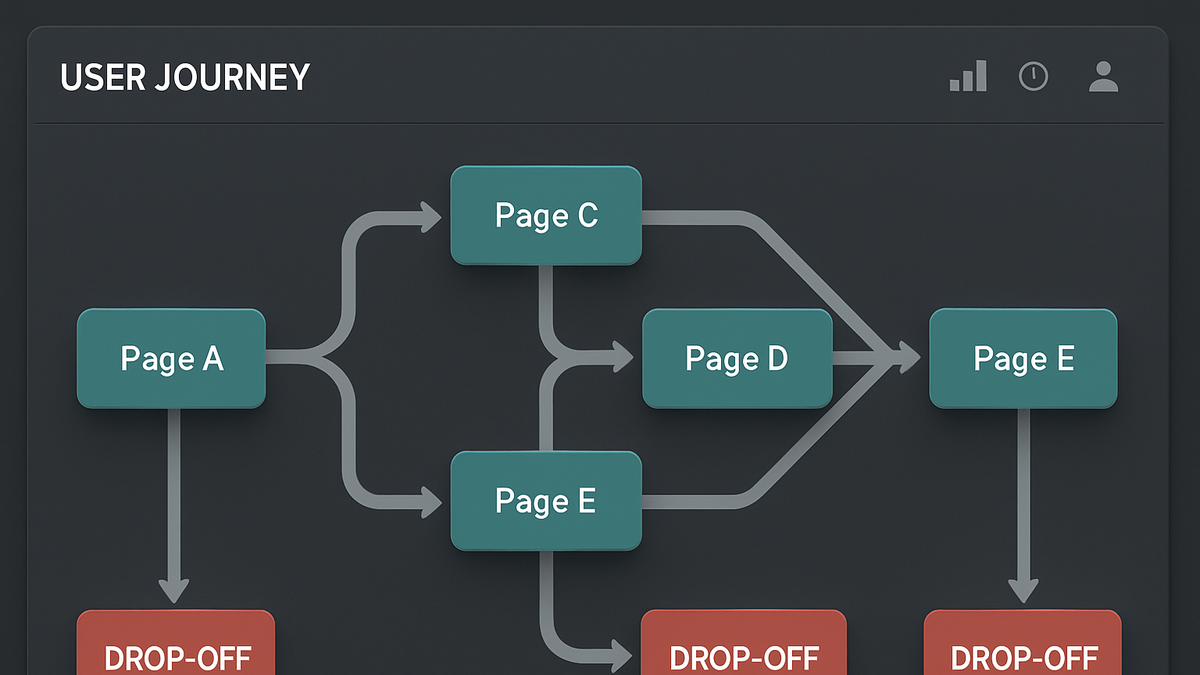
Path Analysis is a method in digital analytics for tracking and visualizing the sequence of user interactions—such as pageviews, clicks, or events—across a website or application. It helps teams understand how users navigate through content, where they drop off, and which paths lead to key conversion points. By mapping these user journeys, analysts can identify bottlenecks, loops, and opportunities for optimization. Path Analysis can be applied to any ordered event data, making it versatile for e-commerce funnels, onboarding flows, or feature adoption studies. Solutions like PlainSignal offer lightweight, cookie-free tracking, while Google Analytics 4 provides advanced path exploration capabilities with its Path Exploration reports. Together, these tools empower teams to make data-driven decisions that enhance user experiences and drive business outcomes.
Path analysis
Visualize and analyze user sequences on your site or app to uncover common journeys, drop-offs, and optimization opportunities.
Why Path Analysis Matters
Path Analysis reveals the actual sequences users follow on your site or app, going beyond aggregate metrics like pageviews. It helps teams understand navigation patterns, identify friction points, and optimize the flow toward conversion or engagement goals.
-
Understand user journeys
By mapping out the sequence of events, analysts can see the most common paths that lead users from entry to key actions such as sign-ups or purchases.
-
Identify drop-off points
Pinpointing where users abandon a flow allows you to address usability issues, unclear calls-to-action, or technical errors that harm conversion rates.
How Path Analysis Works
Path Analysis relies on event sequencing and graph theory to model user interactions as nodes and edges. By analyzing transitions between events, teams can uncover the structure of user flows and measure their frequency.
-
Nodes and events
Events or pageviews act as nodes in the path graph, representing distinct user actions or screens.
-
Edges and transitions
Edges connect nodes based on chronological order, showing the direction and frequency of transitions between events.
Implementing Path Analysis
Getting started with Path Analysis requires proper event instrumentation and the right analytics tool. Below are examples using PlainSignal and GA4.
-
PlainSignal (cookie-free analytics)
To implement path analysis in PlainSignal, insert the tracking code snippet on your site. Example:
<link rel="preconnect" href="//eu.plainsignal.com/" crossorigin />
<script defer data-do="yourwebsitedomain.com" data-id="0GQV1xmtzQQ" data-api="//eu.plainsignal.com" src="//cdn.plainsignal.com/plainsignal-min.js"></script>
After setup, use PlainSignal’s User Paths report to visualize sequences of pageviews and events.
-
Google analytics 4 (GA4)
In GA4, navigate to the “Analysis” workspace and select the “Path exploration” technique. Choose a starting point (e.g., “page_view” event) to visualize user flows, apply segments or filters to refine paths, and analyze downstream or upstream interactions.
Best Practices
Effective Path Analysis depends on clean data and thoughtful configuration. The recommendations below can help ensure accurate insights.
-
Define clear events
Use consistent naming conventions and capture all relevant parameters so each step in the path represents a clear user action.
-
Limit path depth
Set a reasonable maximum number of steps to focus on the most impactful user flows and avoid overwhelming complexity.
-
Segment by user attributes
Filter paths by attributes like device, geography, or acquisition channel to discover targeted optimization opportunities.