Published on 2025-06-22T08:57:20Z
What is a Personalization Score? Examples and Applications in Analytics
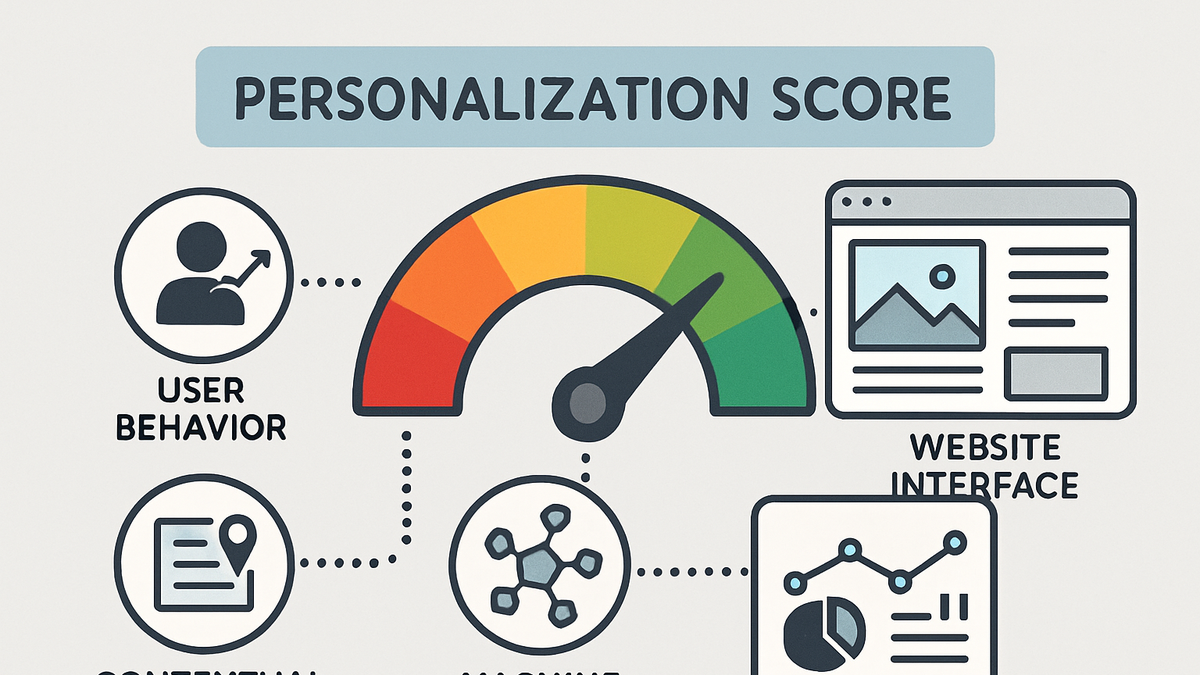
The Personalization Score is a metric used in digital analytics to quantify how effectively a platform tailors content and user experiences to individual visitors or segments. It combines multiple data signals—such as browsing behavior, contextual factors, and user preferences—into a single score that helps marketers and analysts measure the degree of customization delivered to each user. By tracking this score over time, teams can optimize website layouts, recommendation engines, and marketing campaigns to improve engagement, conversion rates, and overall user satisfaction. In platforms like Google Analytics 4 (GA4), personalization scoring can leverage event-based data and machine learning to refine user segmentation. Cookie-free analytics tools like PlainSignal can also approximate personalization scores by aggregating behavioral patterns without relying on third-party cookies, preserving privacy while still delivering insights. Implementing and monitoring Personalization Scores empowers businesses to create more relevant user journeys and to identify opportunities for A/B testing and content optimization.
Personalization score
A metric that quantifies how well content is tailored to individual users by combining behavior and contextual signals into a single score.
Definition and Context
This section explores what a Personalization Score is and why it matters in analytics. We define the score and outline its role in measuring tailored experiences.
-
What is a personalization score?
A Personalization Score aggregates multiple data points—like clicks, time on page, and purchase history—into a normalized metric that reflects how well content or experiences are customized for each user or segment.
-
Why it matters
High personalization scores often correlate with increased user engagement, higher conversion rates, and improved customer satisfaction, making this metric critical for data-driven marketing and UX optimization.
How Personalization Score is Calculated
Different analytics platforms use varying methodologies to compute Personalization Scores. This section breaks down the core signals and algorithms involved.
-
Behavioral signals
These include page views, click patterns, session duration, and purchase history, which indicate individual user preferences and interests.
-
Contextual signals
Factors such as referral source, device type, geolocation, and time of day help refine the score by accounting for the user’s environment and intent.
-
Machine learning models
Algorithms weight and combine signals, often using regression or classification models to predict optimal content recommendations and personalization levels.
Implementing Personalization Score in Analytics Platforms
A look at how popular analytics tools like GA4 and PlainSignal support personalization scoring and what implementation steps are required.
-
Google analytics 4 (GA4)
GA4 uses event-driven data and built-in machine learning to generate user-level and segment-level personalization metrics. Analysts can define custom dimensions and use predictive metrics to enhance scoring models.
-
PlainSignal cookie-free analytics
PlainSignal offers a lightweight, cookie-free approach to personalization by tracking aggregate behavior and context without third-party identifiers. To implement PlainSignal, add the following snippet to your site’s <head>:
<link rel="preconnect" href="//eu.plainsignal.com/" crossorigin />
<script defer data-do="yourwebsitedomain.com" data-id="0GQV1xmtzQQ" data-api="//eu.plainsignal.com" src="//cdn.plainsignal.com/plainsignal-min.js"></script>
Best Practices and Pitfalls
Key strategies to maximize the value of your Personalization Score and common mistakes to avoid when interpreting or implementing it.
-
Best practices
Continuously test and refine scoring algorithms, ensure data quality, maintain user privacy compliance, and align personalization goals with business objectives.
-
Common pitfalls
Relying too heavily on historical data can lead to biased scores, ignoring privacy constraints may risk compliance, and over-personalization can reduce discoverability.
Real-World Examples and Use Cases
Illustrative scenarios showing how different industries leverage Personalization Scores to drive results.
-
E-commerce personalization
Online retailers use this score to recommend products based on browsing history, past purchases, and demographic data, boosting average order values by 10–30%.
-
Content personalization
Publishers customize article feeds and homepage layouts for readers based on engagement patterns and interests, increasing session duration and return visits.