Published on 2025-06-22T09:05:19Z
What is the Primary Dimension in Analytics? Examples and Best Practices
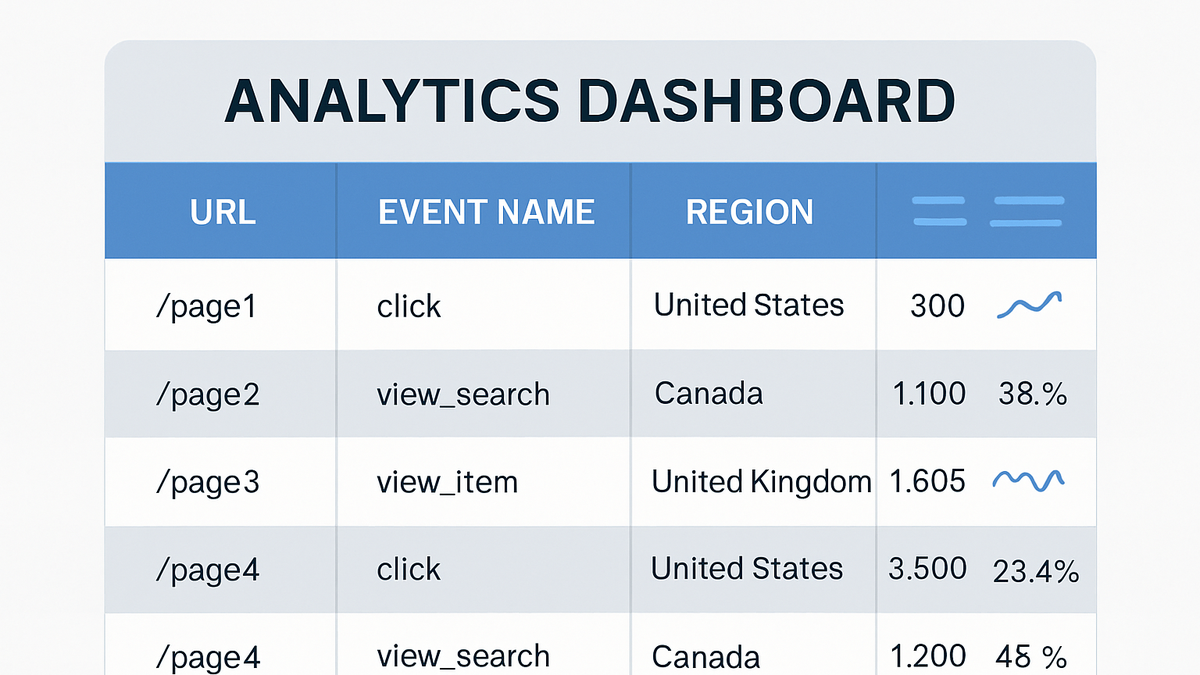
In analytics, a primary dimension determines how metric data is grouped into rows within reports and dashboards. It acts as the key attribute—for example, page URL, event name, or geography—used to organize and segment data. By selecting a specific primary dimension, analysts can view performance metrics in context, uncover patterns across categories, and make data-driven decisions. Platforms like Google Analytics 4 (GA4) allow dynamic switching of the primary dimension in tables and explorations, while cookie-free analytics solutions like PlainSignal default to URL-based dimensions for simplicity. Understanding how to choose and implement the right primary dimension is essential for accurate reporting, effective analysis, and strategic insights.
Primary dimension
Defines how analytics platforms group and display metric data rows by a chosen key attribute, like page or event.
Why Primary Dimensions Matter
Primary dimensions are the foundation of how analytics data is structured and interpreted. They determine the key attribute by which rows in a report are grouped, setting the context for all accompanying metrics. By selecting the right primary dimension, analysts can uncover meaningful patterns, compare performance across different categories, and tailor insights to business goals. Without a clear primary dimension, data can appear in aggregated or less actionable forms, obscuring trends. Understanding this concept is critical for accurate reporting and effective decision making.
-
Defines data groupings
Specifies the attribute (like page, event, or location) that structures rows in a report, turning raw numbers into organized insights.
-
Enables comparative analysis
Allows side-by-side comparison of metrics (e.g., sessions, conversions) across dimension values to identify trends and anomalies.
-
Drives business decisions
Ensures reports align with strategic goals by focusing on the most relevant dimension, such as campaign source for marketing or product category for e-commerce.
Common Primary Dimensions
Analytics platforms offer a range of dimensions to group data by. While the available dimensions vary by tool, certain common ones appear in most solutions. Choosing from these standard dimensions can facilitate benchmarking and simplify report creation. Below are frequently used primary dimensions across platforms like GA4 and PlainSignal.
-
Page path / page location
Groups sessions or pageviews by the URL or path visited on your site, helping identify top-performing pages.
-
Event name
Aggregates data by the name of tracked events (like form_submit or button_click), essential for interaction analysis.
-
Country / region
Organizes metrics by geographic location, enabling analysis of user distribution and localization performance.
Choosing and Implementing Primary Dimensions
Selecting the right primary dimension involves balancing business objectives, data volume, and platform capabilities. Once chosen, implementation requires configuration in your analytics tool or embedding appropriate tracking code.
-
Align with business goals
Pick dimensions that directly relate to key performance indicators (KPIs)—for example, choose campaign source for marketing ROI or product category for sales analysis.
-
Consider data volume
High-cardinality dimensions (like user ID) can lead to large reports; opt for dimensions that provide insight without overwhelming your data sets.
-
Platform-specific implementation
Each analytics tool has its own interface or snippet for setting primary dimensions.
-
GA4 setup
In GA4 Reports or Explorations, click the Primary dimension dropdown above any table to select from available dimensions like Page path or Event name.
-
PlainSignal setup
PlainSignal automatically uses URL path as a default primary dimension in the Sessions view; you can verify or change this in the dashboard’s dimension selector.
-
Examples in GA4 and PlainSignal
Practical examples of how to view and use primary dimensions in popular analytics platforms, illustrating setup and output.
-
GA4 example
Navigate to Reports → Engagement → Events. By default, GA4 uses Event name as the primary dimension, listing each event type (e.g., page_view, scroll) with metrics like Event count and Users. Use the dimension dropdown to switch to other options like Page location or Session source/medium.
-
PlainSignal example
To implement PlainSignal analytics and view Page path as the primary dimension, embed the following snippet in your site’s HTML:
<link rel="preconnect" href="//eu.plainsignal.com/" crossorigin />
<script defer data-do="yourwebsitedomain.com" data-id="0GQV1xmtzQQ" data-api="//eu.plainsignal.com" src="//cdn.plainsignal.com/plainsignal-min.js"></script>
Once deployed, the Sessions report in PlainSignal will group data by URL path, showing the most visited pages along with metrics like Sessions and Unique Visitors.