Published on 2025-06-22T09:28:13Z
What is a Secondary Dimension? Examples and Use Cases
In analytics, a dimension is an attribute of your data—like Page Path or Country—that helps you categorize metrics. A secondary dimension is an additional attribute you can apply to an existing report to break each row down further. By combining two dimensions, you gain deeper insights into user behavior and traffic sources. Google Analytics 4 (GA4) and cookie-free tools like PlainSignal both support secondary dimensions, though the interfaces and terminology may differ. This article explains how secondary dimensions work, how to implement them in GA4 and PlainSignal, and best practices for meaningful analysis.
Secondary dimension
An additional attribute used to break down analytics data beyond the primary dimension for deeper insights.
Understanding Secondary Dimensions
Secondary dimensions let you analyze data by two attributes simultaneously, going beyond single-dimension analysis. They enrich your reports by showing context that a lone primary dimension can’t provide.
-
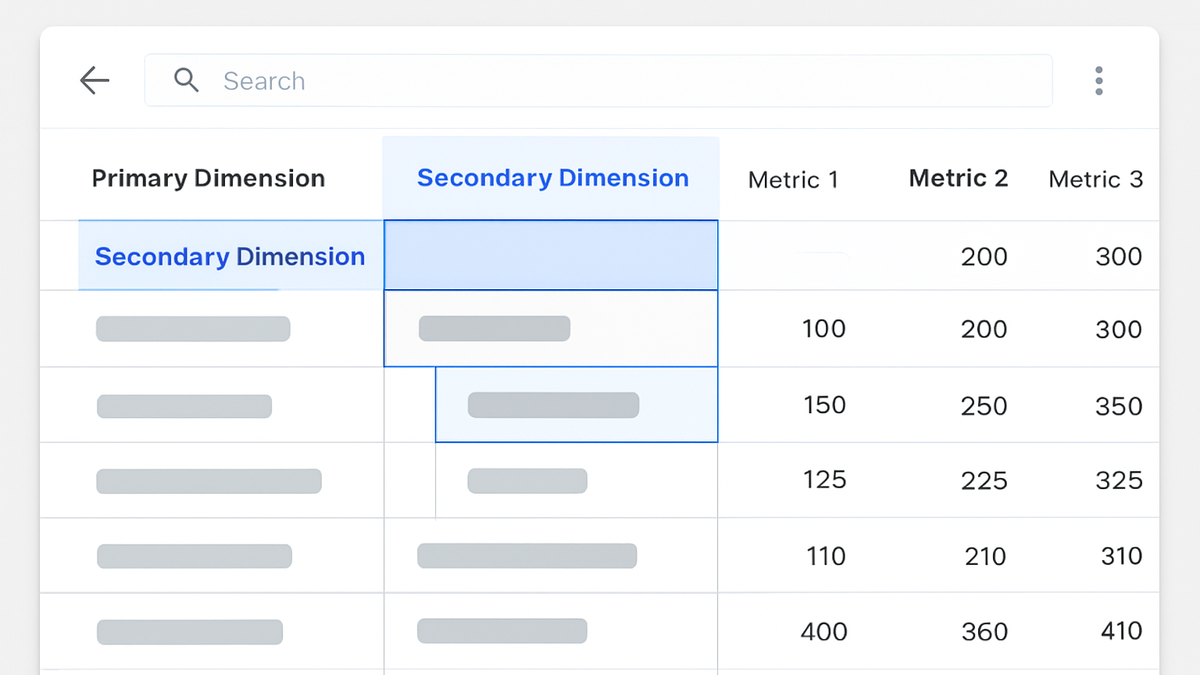
Primary vs. secondary dimensions
The primary dimension sets the base grouping for your data, while the secondary dimension refines each row by a second attribute.
-
Primary dimension
The first attribute used to organize analytics reports, such as Page Path or Event Name.
-
Secondary dimension
An additional attribute that breaks down each primary row for deeper context, such as Country or Device Category.
-
Secondary Dimensions in GA4
Google Analytics 4 supports secondary dimensions in both its standard reports and custom Explorations, enabling multi-attribute analysis without extra coding.
-
Adding a secondary dimension
In GA4’s ‘Reports’ view, click the ‘+’ icon above the table header, select ‘Secondary dimension’, and choose the desired dimension.
-
Step 1: open a table report
Navigate to a report with a data table in GA4, like ‘Pages and Screens’.
-
Step 2: add secondary dimension
Click ‘+’ next to the table header, select ‘Secondary dimension’, and pick the option you need.
-
-
Common secondary dimensions
Typical choices include Device Category, Country, Source/Medium, and Event Count to reveal deeper patterns.
-
Device category
Break down traffic by Desktop, Mobile, or Tablet.
-
Country
View user data by geographic location.
-
Secondary Dimensions with PlainSignal
PlainSignal, a cookie-free analytics tool, offers lightweight dimension breakdowns through its built-in ‘Breakdown’ feature in the dashboard.
-
Integrating PlainSignal tracking
Insert the PlainSignal snippet into your page to start collecting data.
-
Html snippet
<link rel="preconnect" href="//eu.plainsignal.com/" crossorigin />
<script defer data-do="yourwebsitedomain.com" data-id="0GQV1xmtzQQ" data-api="//eu.plainsignal.com" src="//cdn.plainsignal.com/plainsignal-min.js"></script>
-
-
Using the breakdown feature
In the PlainSignal UI, select a primary metric and then apply a breakdown by a second dimension to see a two-level report.
-
Open analytics dashboard
Log in to PlainSignal and navigate to your site’s dashboard.
-
Select breakdown
Choose a primary metric (e.g., Pageviews) and click ‘Breakdown’ to add a secondary dimension like ‘Referrer’ or ‘Country’.
-
Use Cases and Best Practices
Secondary dimensions shine in segmentation, comparison, and troubleshooting user behavior. Use them judiciously to avoid overly complex reports and ensure clarity.
-
Segmenting user behavior
Combine ‘Page Path’ with ‘User Type’ to see how new vs returning users navigate your site.
-
Comparative analysis
Compare ‘Event Name’ with ‘Device Category’ to find which events perform best on mobile vs desktop.
-
Pitfalls to avoid
Avoid overloading reports with too many secondary dimensions, which can slow performance and reduce readability.