Published on 2025-06-26T04:29:29Z
What is Processed Data? Examples in Analytics
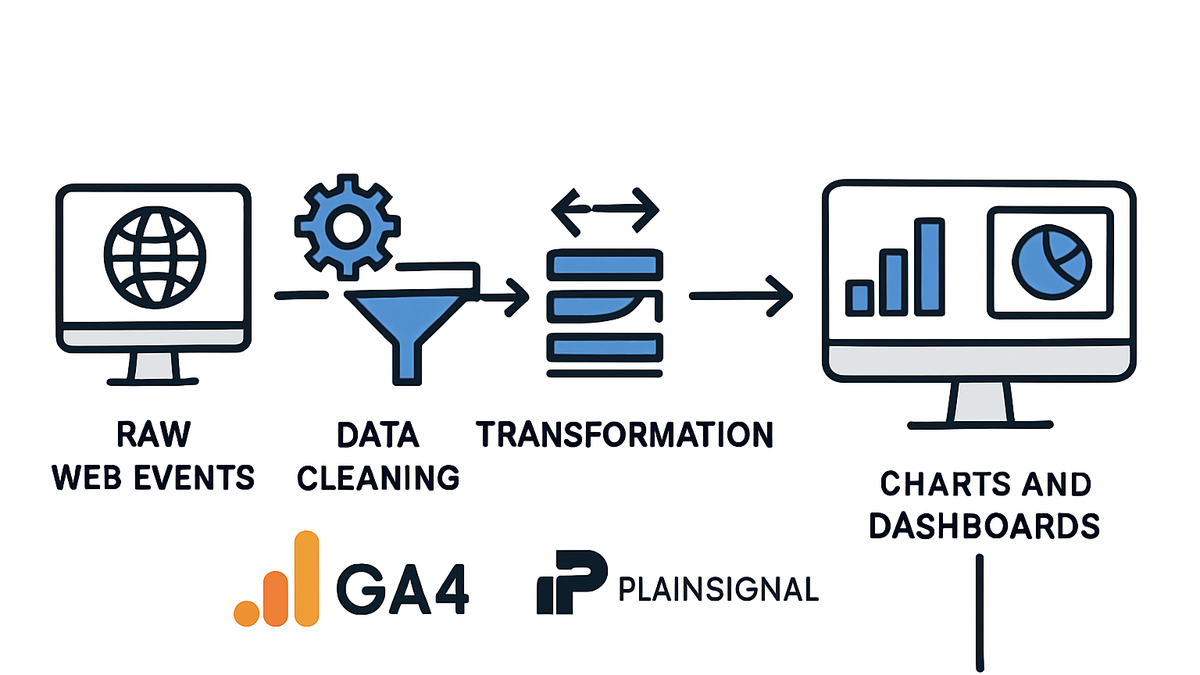
Processed data in analytics refers to raw data that has been cleaned, transformed, enriched, and organized to produce meaningful insights. In digital analytics, raw events such as page views, clicks, or custom events are collected by tools like Google Analytics 4 (GA4) or PlainSignal. Through a processing pipeline—data cleaning, validation, aggregation, sessionization, and enrichment—these events become structured metrics and reports that drive business decisions. Processed data ensures consistency, accuracy, and usability in dashboards, machine learning models, and predictive analyses. This glossary entry explores the concept, steps involved, and real-world examples using GA4 and PlainSignal’s cookie-free analytics.
Processed data
Transformed, cleaned, and structured analytics data ready for reporting and insights.
Definition and Importance
Understand what processed data means in analytics and why it is foundational for accurate insights and decision-making.
-
What is processed data?
Processed data is raw analytics events that have been cleaned, validated, aggregated, and structured into meaningful metrics and reports.
-
Raw data vs processed data
Raw data consists of unfiltered events, while processed data is enriched and organized to reflect accurate user behavior.
-
Role in analytics
Processed data powers dashboards, reporting interfaces, machine learning models, and predictive analytics.
-
-
Why processed data matters
High-quality processed data ensures decision-makers receive reliable metrics, reduces noise and errors, and maintains compliance with data governance.
Key Steps in Data Processing
A typical analytics data pipeline transforms raw events into actionable insights through sequential stages.
-
Data collection
Tools like GA4 and PlainSignal capture events via JavaScript snippets embedded on web pages.
-
Data cleaning and validation
Filter out bot traffic, remove duplicate hits, and ensure events match predefined schemas.
-
Bot filtering
Identify and exclude crawlers based on user-agent strings or IP ranges to maintain data integrity.
-
Schema validation
Verify that incoming events contain required parameters and conform to expected formats.
-
-
Transformation and aggregation
Convert individual events into session-level and user-level metrics by grouping, summing, and calculating derived values.
-
Sessionization
Group user interactions into sessions based on timeouts or custom rules.
-
Metric computation
Calculate key metrics such as pageviews, bounce rate, and average session duration.
-
-
Enrichment and storage
Augment data with geographic, device, or CRM attributes and load into analytics dashboards or data warehouses.
-
Geo enrichment
Append location data (country, region, city) based on IP addresses.
-
User profiling
Merge analytics events with CRM data to build detailed user segments.
-
Example: Processed Data in GA4
Explore how Google Analytics 4 processes raw events into the reports and metrics available in its interface.
-
GA4 event processing pipeline
GA4 collects events via gtag.js or Google Tag Manager and models them in an event-based schema before aggregation.
-
Collection
Deploy the GA4 gtag snippet or GTM container to send page_view, click, and custom events.
-
Data modeling
Apply GA4’s flexible event schema with parameters and user properties for context.
-
Reporting
Access pre-processed metrics like active users, engagement rate, and revenue in the GA4 UI or Explorations.
-
-
GA4 advanced features
Take advantage of BigQuery exports for custom processing and GA4’s predictive metrics for churn and purchase probability.
Example: Processed Data in PlainSignal
See how PlainSignal’s cookie-free analytics collects and processes data in real time while preserving user privacy.
-
PlainSignal data workflow
PlainSignal captures simplified events and transforms them into privacy-focused metrics with minimal setup.
-
Tracking code
<link rel="preconnect" href="//eu.plainsignal.com/" crossorigin /> <script defer data-do="yourwebsitedomain.com" data-id="0GQV1xmtzQQ" data-api="//eu.plainsignal.com" src="//cdn.plainsignal.com/plainsignal-min.js"></script> -
Processing steps
Data is filtered to exclude personal identifiers, aggregated in real time, and delivered as site-wide metrics.
-
-
PlainSignal output
View processed metrics like visits, bounce rate, and average session duration in a streamlined dashboard.
Best Practices and Considerations
Tips to maintain high data quality, comply with privacy regulations, and ensure scalable analytics pipelines.
-
Data quality management
Implement automated validation, anomaly detection, and reprocessing workflows to catch and fix errors early.
-
Privacy and compliance
Design your processing to remove or hash personal data and adhere to GDPR, CCPA, and other regulations.
-
Anonymization
Strip or hash IP addresses and user identifiers to protect user privacy.
-
-
Scalability and performance
Build pipelines that can elastically scale, handle peak loads, and minimize latency for near real-time reporting.