Published on 2025-06-22T09:06:30Z
What is Product Analytics? Examples & Tools
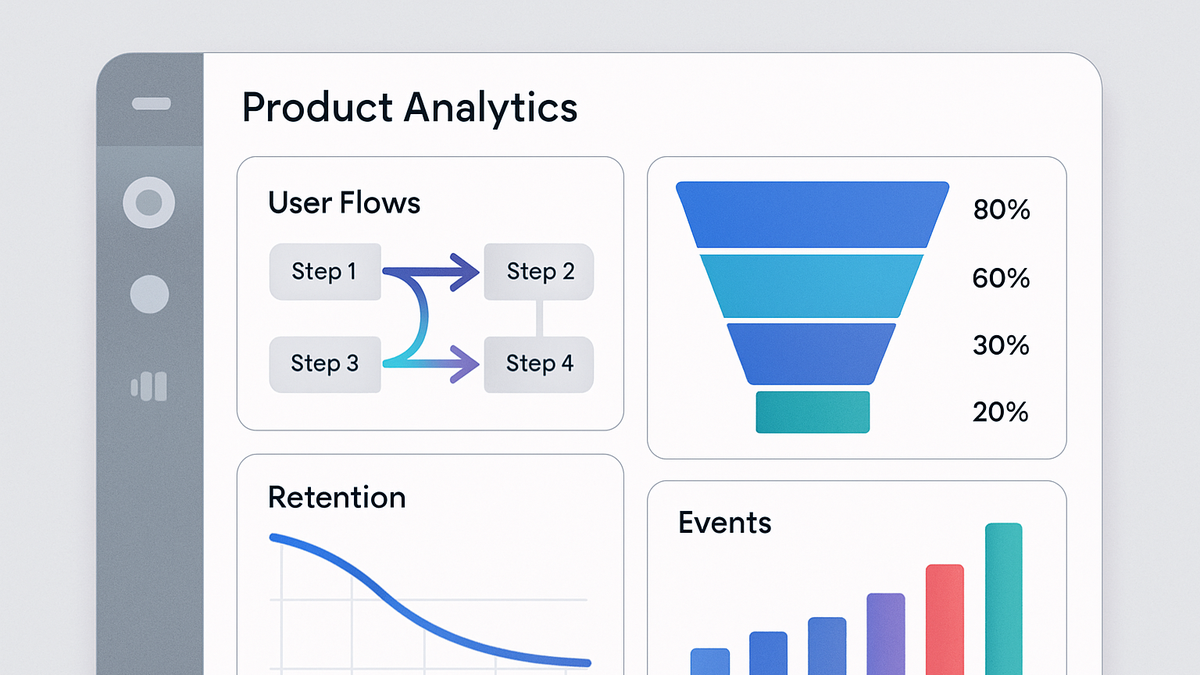
Product Analytics is the practice of measuring, analyzing, and interpreting user interactions within a digital product. It captures event-level data such as clicks, page views, screen views, and custom-defined actions to reveal how users engage with features and workflows. By combining quantitative metrics with qualitative insights, product teams can identify friction points, optimize user flows, and prioritize development efforts. Modern product analytics solutions, like Google Analytics 4 (GA4) and PlainSignal, provide event tracking, funnel analysis, cohort reports, and A/B testing integrations. These tools enable data-driven decision-making that aligns product roadmaps with real user behavior. Ultimately, product analytics empowers organizations to deliver more intuitive, engaging, and successful products.
Product analytics
Measuring and analyzing user interactions within a product to optimize features and inform development decisions.
Overview of Product Analytics
This section introduces the concept, objectives, and core components of product analytics within digital product management.
-
Definition & purpose
Product analytics refers to the process of collecting and analyzing data on how users interact with features and flows inside a digital product. It helps teams understand behavior patterns, measure feature adoption, and make data-informed decisions to improve user experience.
-
Key components
Core aspects include event tracking, user segmentation, funnel analysis, and cohort reporting. Together, these components paint a holistic picture of user engagement and product performance.
Key Metrics in Product Analytics
Explore the essential metrics used to gauge user behavior and product health over time.
-
User engagement
Measures how frequently and deeply users interact with the product, using metrics like active users, session duration, and feature usage.
-
Retention rate
The percentage of users who return to the product after their first visit, indicating stickiness and long-term value.
-
Conversion rate
The proportion of users who complete a desired action (e.g., signup, purchase), highlighting the effectiveness of your funnels.
-
Churn rate
The rate at which users stop using the product within a given period, a critical indicator of product health.
-
Time to first key action
Average time it takes for a new user to complete an initial valuable action (e.g., first transaction, first post).
Implementation with SaaS Tools
Guidance on how to instrument your product using popular analytics platforms for event-driven insights.
-
PlainSignal
PlainSignal is a privacy-first, cookie-free product analytics tool that captures user events with minimal setup and no cookies. It offers simple dashboards for pageviews, sessions, and custom events while adhering to GDPR and CCPA guidelines.
-
Tracking snippet
Include the following code on your site:
<link rel="preconnect" href="//eu.plainsignal.com/" crossorigin />
<script defer data-do="yourwebsitedomain.com" data-id="0GQV1xmtzQQ" data-api="//eu.plainsignal.com" src="//cdn.plainsignal.com/plainsignal-min.js"></script>
-
-
Google analytics 4 (GA4)
GA4 is Google’s event-driven analytics platform that unifies web and app data, leverages AI-powered insights, and supports custom event definitions and user properties.
-
Basic setup
Add the following within your
<head>to initialize GA4:<script async src="https://www.googletagmanager.com/gtag/js?id=G-XXXXXXXXXX"></script> <script> window.dataLayer = window.dataLayer || []; function gtag(){dataLayer.push(arguments);} gtag('js', new Date()); gtag('config', 'G-XXXXXXXXXX'); </script>
-
Benefits & Use Cases
Discusses the primary advantages of product analytics and how teams leverage it in practice.
-
Improve user experience
Identify friction points by analyzing drop-off in funnels and session replays to streamline workflows and enhance usability.
-
Optimize feature development
Prioritize features based on data about which ones drive engagement, retention, or revenue, ensuring maximum ROI on engineering efforts.
-
Data-driven roadmapping
Use trend analysis, cohort performance, and experiment results to shape long-term product strategy and align stakeholders.
Best Practices & Common Pitfalls
Recommendations for establishing robust analytics and avoiding frequent mistakes that can skew insights.
-
Data quality & governance
Maintain consistent event definitions, implement version control for tracking plans, and regularly audit data to prevent gaps or duplicates.
-
Event taxonomy & naming
Adopt a clear, standardized naming convention for events, parameters, and user attributes to simplify analysis and cross-team collaboration.
-
Privacy & compliance
Minimize personally identifiable information, offer user opt-outs, and leverage cookie-free approaches (e.g., PlainSignal) to comply with GDPR, CCPA, and other regulations.