Published on 2025-06-22T04:51:10Z
What is Recurring Revenue? Analytics Tracking & Examples
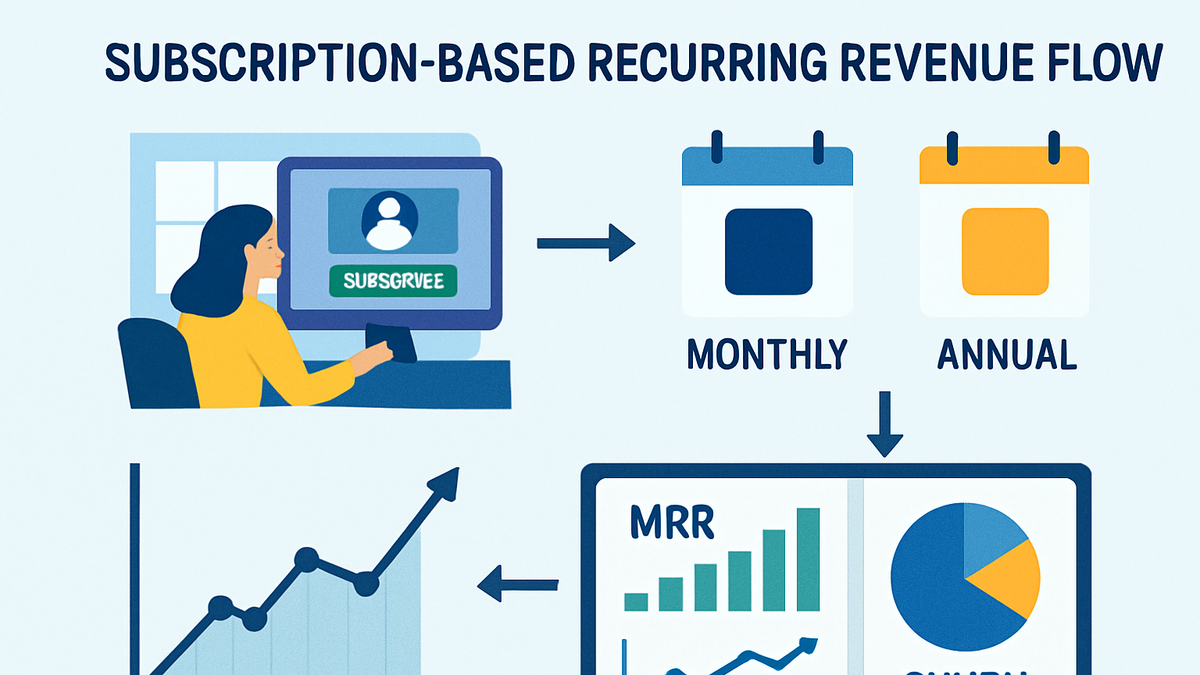
Recurring Revenue is the revenue earned from ongoing, predictable payments at regular intervals, such as subscriptions or memberships. It is critical for businesses that operate on subscription or service models, enabling them to forecast cash flow, measure customer health, and drive sustainable growth. Tracking recurring revenue in analytics platforms—like Google Analytics 4 (GA4) and PlainSignal—helps teams understand subscription upgrades, renewals, and churn in a cohesive dashboard. By centralizing metrics such as Monthly Recurring Revenue (MRR) and Annual Recurring Revenue (ARR), companies can identify trends, pinpoint growth opportunities, and reduce customer churn. Implementing event tracking and custom metrics ensures that each renewal or subscription event is accurately recorded, providing actionable insights for product and marketing teams.
Recurring revenue
Predictable, subscription-based income measured regularly to forecast growth, monitor churn, and optimize customer value.
Why Recurring Revenue Matters
Recurring revenue provides stable cash flow and deeper insights into business health. Unlike one-time sales, recurring streams allow continuous forecasting, improved budgeting, and stronger investor confidence. Subscription models foster long-term customer relationships, yielding actionable data on usage patterns and renewal behavior. Analytics teams rely on tracking renewal events to spot churn early and craft retention strategies.
-
Predictable cash flow
With recurring revenue, finance teams can forecast monthly and annual income accurately, reducing financial uncertainty.
-
Sustainable growth
Subscription models encourage upsells, cross-sells, and plan upgrades, driving scalable revenue expansion through customer segmentation.
-
Customer insights
Recurring payments reveal engagement patterns, enabling targeted interventions to reduce churn and increase lifetime value.
Key Metrics & Ratios
Several metrics help teams assess and optimize recurring revenue streams. These quantitative measures reveal the velocity of growth, customer retention, and financial health.
-
Monthly recurring revenue (mrr)
The total subscription revenue normalized over a month. Track additions, expansions, churn, and contractions to decompose MRR growth.
-
Annual recurring revenue (arr)
The yearly equivalent of MRR, useful for long-term financial planning and comparing annual performance across periods.
-
Churn rate
The percentage of subscribers who cancel during a period. High churn signals retention issues and reduces net revenue.
-
Customer lifetime value (clv)
Estimated net profit from a customer over their entire relationship. Guides acquisition spend and product development.
Tracking Recurring Revenue in Analytics Tools
Implementing accurate recurring revenue tracking requires event-based analytics and custom definitions. Below are examples using GA4 and PlainSignal.
-
GA4 event implementation
In Google Analytics 4, set up a custom event like subscription_renewal to capture revenue parameters such as value, currency, and subscription status.
-
Example gtag.js code
gtag('event', 'subscription_renewal', {
  'transaction_id': 'T12345',
  'value': 29.99,
  'currency': 'USD',
  'subscription_type': 'monthly'
});
-
-
PlainSignal cookie-free tracking
PlainSignal provides simple, privacy-friendly analytics without cookies. To track recurring revenue events, embed their script and trigger a custom event on renewals.
-
Setup script
<link rel='preconnect' href='//eu.plainsignal.com/' crossorigin /> <script defer data-do='yourwebsitedomain.com' data-id='0GQV1xmtzQQ' data-api='//eu.plainsignal.com' src='//cdn.plainsignal.com/plainsignal-min.js'></script> -
Custom renewal event
window.PlainSignal('track', 'subscription_renewal', {
  value: 49.99,
  currency: 'EUR',
  subscription_period: 'annual'
});
-
Best Practices for Reporting & Optimization
Adhering to best practices ensures data quality and actionable insights for recurring revenue analytics.
-
Standardize event naming
Use consistent naming conventions across platforms to ensure clarity in dashboards and reduce mapping errors.
-
Validate data regularly
Regularly audit event and revenue data to catch discrepancies, stale configurations, or tracking failures.
-
Integrate with bi tools
Export data to business intelligence or visualization tools (e.g., Looker, Tableau) for deeper cross-source analysis.
-
Segment and analyze
Break down revenue by plan type, cohort, or acquisition channel to uncover optimization opportunities.