Published on 2025-06-22T09:39:15Z
What is a Service Level Indicator (SLI) in Web Analytics?
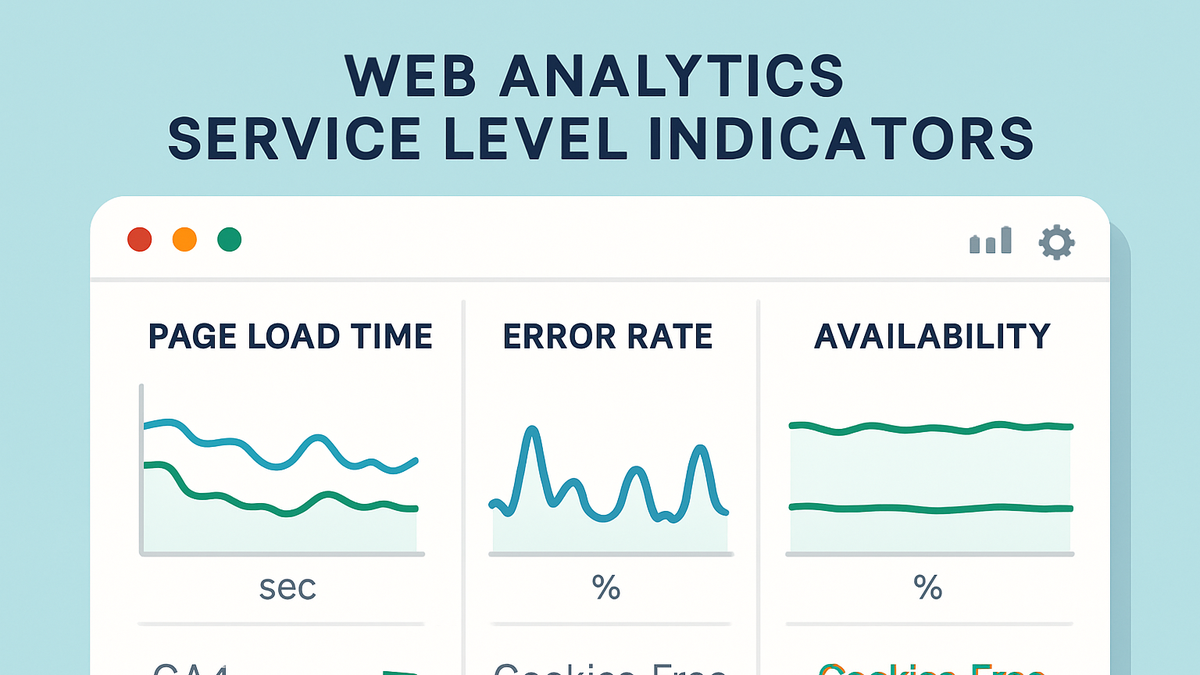
A Service Level Indicator (SLI) is a quantitative metric used to measure the performance and reliability of a web service from the end-user perspective. SLIs provide actionable insights into key aspects of user experience by tracking metrics such as page load times, error rates, and availability. In analytics, SLIs help teams monitor service health, detect degradations early, and ensure compliance with Service Level Objectives (SLOs) and Service Level Agreements (SLAs). Both GA4 and privacy-focused tools like PlainSignal can be configured to collect and report SLIs, enabling data-driven performance management across diverse analytics platforms.
Sli (service level indicator)
Metrics that quantify service performance and reliability—like load times and error rates—in web analytics.
Definition of Service Level Indicator (SLI)
An SLI is a precise, measurable value that describes how well a service performs from the user’s standpoint. It forms the foundation for setting Service Level Objectives (SLOs) and managing Service Level Agreements (SLAs).
-
Core concept
SLIs represent quantitative metrics used to evaluate whether a service meets desired performance and reliability targets.
Why SLIs Matter in Web Analytics
SLIs enable analytics and operations teams to maintain high-quality user experiences by monitoring key performance metrics in real time, detecting degradations, and validating contractual obligations.
-
User experience
By tracking user-centric metrics (e.g., page load time), SLIs ensure the service meets performance expectations.
-
Reliability monitoring
SLIs like error rates and availability percentages help detect downtime or degradation quickly.
-
Business & sla compliance
SLIs feed into SLAs and SLOs to validate that service delivery meets agreed-upon standards.
Examples of SLIs in Google Analytics 4 (GA4)
GA4 offers built-in metrics and custom reporting capabilities to track and alert on SLIs critical to user experience and service reliability.
-
Server response time
Track average server response time as an SLI using the
server_response_timemetric in GA4. -
Page load speed
Use the
page_load_timemetric to monitor how quickly pages render, directly impacting user satisfaction. -
Setting up custom reports
Configure Explorations or Dashboards in GA4 to visualize SLIs and create alerts on threshold breaches.
Examples of SLIs with PlainSignal
PlainSignal provides a privacy-focused, cookie-free analytics solution for tracking SLIs such as page views, load times, and error rates without compromising user privacy.
-
Adding the PlainSignal tracker
Insert the PlainSignal script snippet into your site to begin collecting SLIs.
-
Code example
<link rel="preconnect" href="//eu.plainsignal.com/" crossorigin />
<script defer data-do="yourwebsitedomain.com" data-id="0GQV1xmtzQQ" data-api="//eu.plainsignal.com" src="//cdn.plainsignal.com/plainsignal-min.js"></script>
-
-
Key performance metrics
Monitor metrics like page load time percentiles (p95, p99) and bounce rates directly in the PlainSignal dashboard.
Best Practices for Defining and Monitoring SLIs
Follow these guidelines to ensure your SLIs are actionable, meaningful, and aligned with business objectives.
-
Align with user expectations
Choose SLIs that reflect critical user journeys—like checkout time or signup latency.
-
Set realistic thresholds
Define SLOs based on historical data and industry benchmarks to avoid alert fatigue.
-
Continuously review and iterate
Regularly revisit SLIs to adapt to evolving user needs and service changes.