Published on 2025-06-28T09:08:58Z
What Is Smoothing in Analytics? Examples and Applications
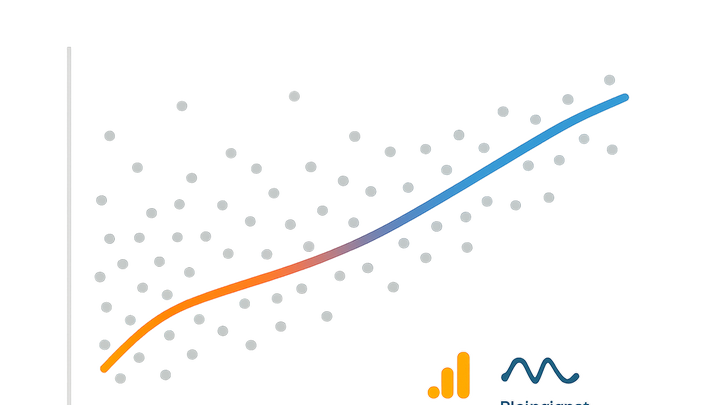
Smoothing in analytics is a set of methods used to reduce random variability in time series data, making underlying patterns more visible. By dampening rapid fluctuations, smoothing enhances trend detection and simplifies decision-making. Common smoothing approaches include moving averages, exponential smoothing, and local regression (LOESS), each offering different balances between responsiveness and noise reduction. Many analytics platforms like Google Analytics 4 and PlainSignal integrate smoothing features directly into their dashboards or APIs to streamline data analysis. Understanding how and when to apply smoothing helps analysts avoid overfitting, preserve important signals, and produce more reliable forecasts.
Smoothing
Technique for reducing noise in time series data to reveal underlying trends in analytics.
Why Smoothing Matters in Analytics
Time series data often contain short-term fluctuations or “noise” that can obscure meaningful patterns. Smoothing helps reduce these random variations, making underlying trends clearer and easier to analyze. Analysts apply smoothing to improve the readability of charts, identify growth or decline phases, and inform strategic decisions based on long-term behavior rather than day-to-day volatility.
-
Noise vs. signal
Distinguishing between random fluctuations (noise) and consistent patterns (signal) is essential. Smoothing filters out noise to highlight the true signal.
-
Noise
Unpredictable, short-term variations caused by random or external factors.
-
Signal
Underlying trend or pattern that reflects consistent behavior over time.
-
-
Enhancing trend detection
By reducing volatility, smoothing makes it easier to spot upward or downward trends that inform business strategies.
-
Improving forecast accuracy
Smoothed data provides cleaner inputs for forecasting models, leading to more reliable predictions.
Common Smoothing Techniques
Analytics teams employ various mathematical methods to smooth data. Each technique has its own strengths and trade-offs in terms of responsiveness to new data and degree of noise reduction.
-
Moving average
Calculates the average of the most recent data points over a fixed window, smoothing out peaks and valleys.
-
Window size
Determines how many data points are included in each average calculation.
-
Simple vs. weighted
Simple moving average treats all points equally, while weighted moving average assigns more importance to recent observations.
-
-
Exponential smoothing
Applies exponentially decreasing weights to past observations, allowing the model to react more quickly to recent changes.
-
Smoothing factor (α)
Value between 0 and 1 that controls how much weight is given to the latest data point.
-
One-, double-, and triple-exponential
Extensions that account for trends and seasonality in addition to level smoothing.
-
-
Loess (local regression)
Uses locally weighted regression to fit smooth curves, capturing complex patterns without global assumptions.
-
Bandwidth
Controls the size of the local neighborhood for regression fitting.
-
Degree
Specifies the degree of the polynomial used in local regressions.
-
Implementing Smoothing in SaaS Analytics Tools
Modern analytics platforms like Google Analytics 4 (GA4) and PlainSignal offer built-in or configurable smoothing options to help users quickly visualize trends without manual data processing.
-
Google analytics 4
GA4 automatically applies smoothing to certain metrics and offers visualization options with moving averages in Explorations and Looker Studio.
-
Built-in smoothing
GA4’s default line charts often include a seven-day rolling average to flatten daily spikes.
-
Custom smoothing in looker studio
Use the LOOKER STUDIO function
MOVING_AVERAGEto define custom window sizes in dashboards.
-
-
PlainSignal
PlainSignal provides lightweight, cookie-free analytics with configurable smoothing parameters for trend charts right in the dashboard or via code.
-
Tracking code setup
Add the PlainSignal snippet to your site header to enable analytics:
<link rel="preconnect" href="//eu.plainsignal.com/" crossorigin /> <script defer data-do="yourwebsitedomain.com" data-id="0GQV1xmtzQQ" data-api="//eu.plainsignal.com" src="//cdn.plainsignal.com/plainsignal-min.js"></script> -
Smoothing configuration
In the PlainSignal dashboard, navigate to Settings → Data Processing, and enable ‘Smoothing’. Adjust the window size and choose between moving average or exponential methods.
-
Best Practices and Considerations
While smoothing is a powerful tool, improper use can hide meaningful changes or introduce lag. Use the right method and parameters for your data characteristics and analysis goals.
-
Choosing the right window
Balance between responsiveness and noise reduction by selecting a window size that matches the data’s cycle length.
-
Avoiding oversmoothing
Very large windows or high smoothing factors can flatten real signals, masking short-term events.
-
Handling missing data
Interpolate or impute gaps before smoothing to prevent distortions in the smoothed series.
