Published on 2025-06-26T04:24:59Z
What is Time Series Forecasting? Examples & Use Cases
Time series forecasting is the process of analyzing historical data points collected over time to predict future trends and patterns. In analytics, it helps organizations anticipate user behavior, traffic spikes, and business metrics. By identifying underlying components such as trend, seasonality, and cyclical fluctuations, analysts can choose suitable models to generate accurate forecasts. Common tools like GA4 and PlainSignal provide the raw time-stamped data needed for modeling, while specialized algorithms such as ARIMA, exponential smoothing, and machine learning methods perform the heavy lifting. Accurate forecasts enable informed decision-making in marketing, inventory management, capacity planning, and financial projections. However, proper data preprocessing, model validation, and ongoing monitoring are crucial to maintain reliability as conditions evolve.
Time series forecasting
Predicting future values based on historical data patterns in analytics platforms like GA4 and PlainSignal.
Overview of Time Series Forecasting
In analytics, understanding past performance is only half the story—forecasting reveals what lies ahead. Time series forecasting applies algorithms to historical metrics like pageviews, sessions, or conversions to estimate their future trajectories. These insights help teams prepare for spikes in traffic, budget campaigns more effectively, and optimize infrastructure capacity. Integrating forecasting into dashboards allows stakeholders to visualize expected trends alongside actual performance.
-
Definition
Time series forecasting is a technique that analyzes historical, time-ordered data points to estimate future values. Unlike simple predictions, it accounts for temporal dependencies and patterns.
-
Importance in analytics
By forecasting metrics such as user visits, revenue, and engagement, organizations can make proactive decisions. Forecasts enable optimization of marketing spend, inventory levels, and resource allocation before changes occur.
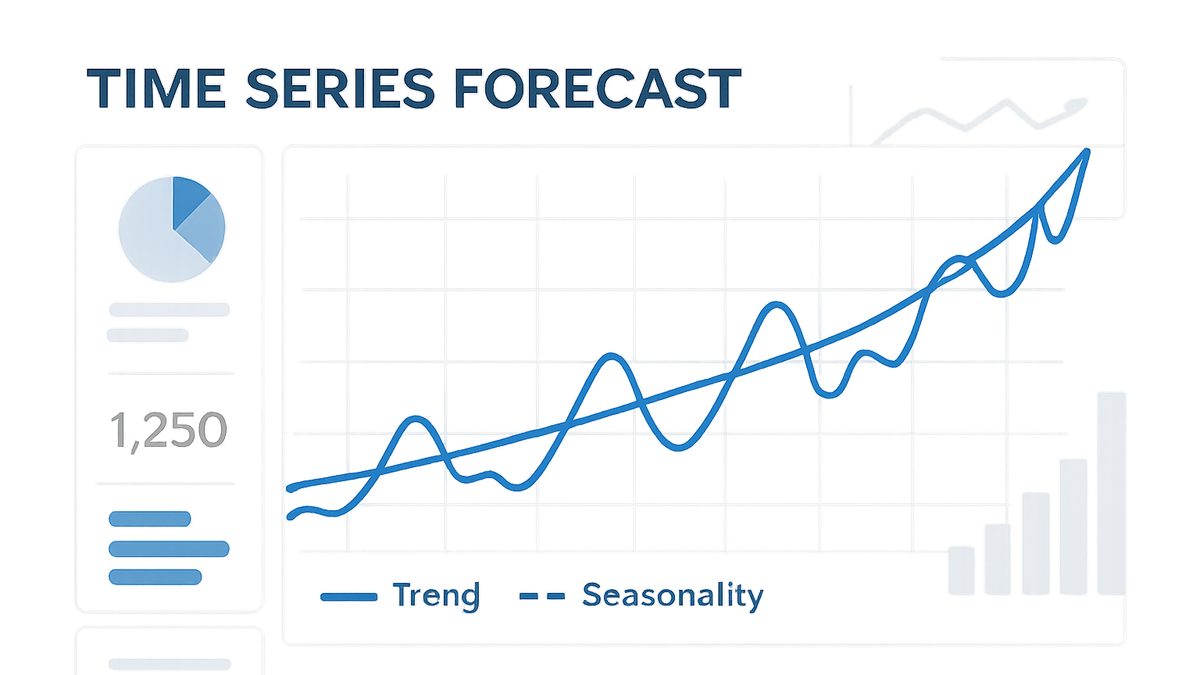
Core Components and Patterns
Every time series comprises several components that models must capture:
- Trend: Long-term upward or downward movement in the data.
- Seasonality: Regular, repeating patterns over fixed periods.
- Cyclicality: Fluctuations tied to economic cycles or external events.
- Noise: Random, unexplained variations.
Identifying these patterns is critical for choosing and tuning forecasting models.
-
Trend
Represents the long-term progression of the series, indicating gradual increases or decreases over time.
-
Seasonality
Captures regular and predictable patterns that repeat over known, fixed periods like days, weeks, or months.
-
Cyclicality
Reflects longer-term fluctuations influenced by business or economic cycles, often without a fixed period.
-
Noise
Encompasses random, irregular variations that cannot be attributed to trend, seasonality, or cyclicality.
Common Forecasting Techniques
Forecasting methods range from classical statistical models to modern machine learning approaches. Statistical techniques like ARIMA and exponential smoothing are popular for their interpretability, while ML methods such as Facebook Prophet and LSTM networks offer flexibility for capturing complex patterns. The choice of method depends on data characteristics, forecast horizon, and computational resources.
-
Arima models
AutoRegressive Integrated Moving Average (ARIMA) models combine autoregression, differencing, and moving average components to model non-stationary time series.
-
Exponential smoothing
Techniques like Simple, Holt’s Linear, and Holt-Winters smoothing add parameters to capture level, trend, and seasonality with minimal complexity.
-
Machine learning methods
Machine learning algorithms can learn non-linear relationships and handle multiple predictors. Common choices include:
-
Facebook prophet
An additive model designed for business forecasting with built-in seasonality handling and holiday effects.
-
Lstm networks
Recurrent neural networks that excel at learning long-term dependencies in sequential data.
-
Implementing Time Series Forecasting in Analytics Platforms
You can leverage data from analytics tools like GA4 and PlainSignal to build forecasts. Both platforms provide time-stamped event and session data ideal for forecasting pipelines. Below are setup instructions and code examples.
-
GA4 data extraction
Use the GA4 Reporting API or BigQuery export to retrieve historical event and user metrics. Aggregate metrics at consistent intervals (e.g., hourly or daily) before modeling.
-
PlainSignal integration
PlainSignal offers a cookie-free, privacy-friendly analytics solution. Embed its tracking code on your site to capture pageviews and events without cookies.
-
Example PlainSignal tracking code
<link rel="preconnect" href="//eu.plainsignal.com/" crossorigin />
<script defer data-do="yourwebsitedomain.com" data-id="0GQV1xmtzQQ" data-api="//eu.plainsignal.com" src="//cdn.plainsignal.com/plainsignal-min.js"></script>
-
-
Data preparation
Clean and preprocess the extracted time series: handle missing values, remove outliers, and ensure stationarity with transformations like differencing or log scaling. Split data into training and test sets based on time.
Best Practices and Considerations
To maximize forecast accuracy and reliability, follow these best practices and be aware of common pitfalls.
-
Data quality
Ensure completeness and consistency in your series. Missing or erroneous data can lead to inaccurate forecasts.
-
Stationarity & seasonality
Test for non-stationarity and apply techniques like differencing or detrending. Model seasonality explicitly if present.
-
Model evaluation
Use metrics such as Mean Absolute Error (MAE), Root Mean Squared Error (RMSE), and Mean Absolute Percentage Error (MAPE) to assess forecast performance.
-
Regular retraining
Retrain models periodically or when data patterns shift significantly to maintain forecast relevance.