Published on 2025-06-26T05:15:42Z
What is Transaction Revenue? Examples for Transaction Revenue
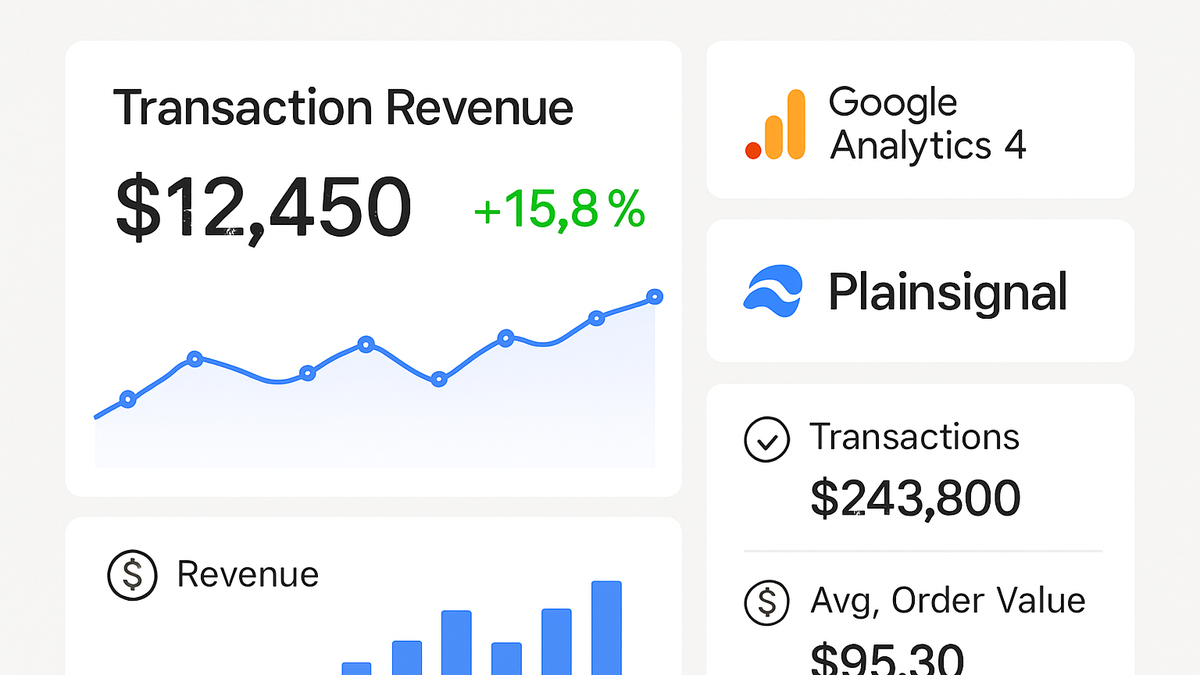
Transaction Revenue is the total monetary value of all purchase transactions recorded by an analytics platform within a given period. It represents the actual sales revenue generated through your website or app, including product costs, taxes, shipping fees, and other charges. This metric is essential for understanding sales performance, calculating marketing ROI, and making data-driven decisions about pricing, promotions, and budget allocation.
Both Google Analytics 4 (GA4) and cookie-free analytics tools like
PlainSignal enable you to capture transaction revenue, albeit with different
implementation approaches. GA4 uses ecommerce events such as purchase to send revenue values,
whereas PlainSignal employs a lightweight tracking snippet that prioritizes user privacy without
sacrificing essential revenue insights.
Accurate transaction revenue tracking depends on proper setup, validation, and ongoing monitoring. Below, we explore why this metric matters, how to implement it in GA4 and PlainSignal, and best practices for analyzing your revenue data.
Transaction revenue
Total monetary value of tracked purchase transactions, essential for measuring sales performance and ROI.
Why Transaction Revenue Matters
Transaction Revenue is more than just a number—it is a key performance indicator that directly reflects your business’s sales health. By monitoring this metric, you can:
- Measure overall sales performance over time.
- Attribute revenue to marketing channels and campaigns.
- Identify seasonal trends and growth opportunities.
Without accurate transaction revenue data, decisions about budgets, promotions, and inventory may be based on incomplete insights.
-
Track sales performance
Transaction Revenue shows the total monetary value of purchases recorded on your site or app.
-
Trend analysis
Compare revenue over time to identify growth patterns or seasonal dips.
-
Channel attribution
Attribute revenue to marketing channels to see which campaigns drive the most sales.
-
-
Optimize marketing roi
By linking revenue to acquisition channels, you can calculate return on ad spend and optimize budgets.
-
Cost vs. revenue
Compare advertising costs against revenue generated to calculate ROI.
-
Campaign performance
Identify top-performing campaigns based on actual sales revenue.
-
Tracking Transaction Revenue
Transaction revenue can be implemented in various analytics platforms. Below are common methods for GA4 and PlainSignal:
-
Google analytics 4 (GA4)
In GA4, transaction revenue is captured via the ecommerce
purchaseevent, with revenue values sent as parameters likevalueandcurrency.-
Implementation
Use the gtag.js ecommerce plugin or Google Tag Manager, sending a
purchaseevent with the relevant parameters. -
Example code
gtag('event', 'purchase', { currency: 'USD', value: 99.99, transaction_id: 'T12345' });
-
-
PlainSignal (cookie-free analytics)
PlainSignal offers a lightweight, privacy-focused approach where transaction revenue is tracked without cookies using a simple snippet.
-
Tracking code
Include the PlainSignal script on your site and configure transaction details via the API.
-
Example snippet
<link rel="preconnect" href="//eu.plainsignal.com/" crossorigin />
<script defer data-do="yourwebsitedomain.com" data-id="0GQV1xmtzQQ" data-api="//eu.plainsignal.com" src="//cdn.plainsignal.com/plainsignal-min.js"></script>
-
Best Practices for Transaction Revenue Analysis
To ensure your revenue data is accurate and actionable, adopt these best practices for validation, reporting, and optimization.
-
Data validation
Regularly verify that the revenue values sent to your analytics platform match actual sales figures.
-
Test purchases
Perform test transactions with known amounts to confirm reporting accuracy.
-
Cross-reference
Compare analytics data to backend order management or CRM systems.
-
-
Reporting and dashboarding
Create clear visualizations and reports to monitor revenue trends and performance.
-
Custom reports
Use GA4 Explorations or PlainSignal dashboard filters to segment revenue by source, product, or geography.
-
Key metrics
Track metrics like Average Order Value, Revenue Per User, and Conversion Rate alongside transaction revenue.
-