Published on 2025-06-27T21:43:29Z
What is True Positive Rate in Analytics? Examples with PlainSignal and GA4
In analytics, the True Positive Rate (TPR), also known as recall or sensitivity, measures the proportion of actual positive events that are correctly identified by a tracking system. It is a key performance indicator for conversion tracking, anomaly detection, and overall data quality. A high TPR indicates that your analytics setup is capturing most of the events that truly occurred, reducing the risk of underreporting valuable user actions.
This metric complements other measures like precision (or Positive Predictive Value), providing a balanced view of both completeness and accuracy. In this article, we explore the definition, calculation, practical examples using GA4 and PlainSignal, and strategies to improve TPR in your analytics workflows.
True positive rate
True Positive Rate measures the share of actual positive events correctly captured, essential for evaluating analytics accuracy.
Definition and Formula
The True Positive Rate (TPR) quantifies the ratio of correctly identified positive events to all actual positive events. It answers the question: “Of all real events, how many did we successfully track?”
-
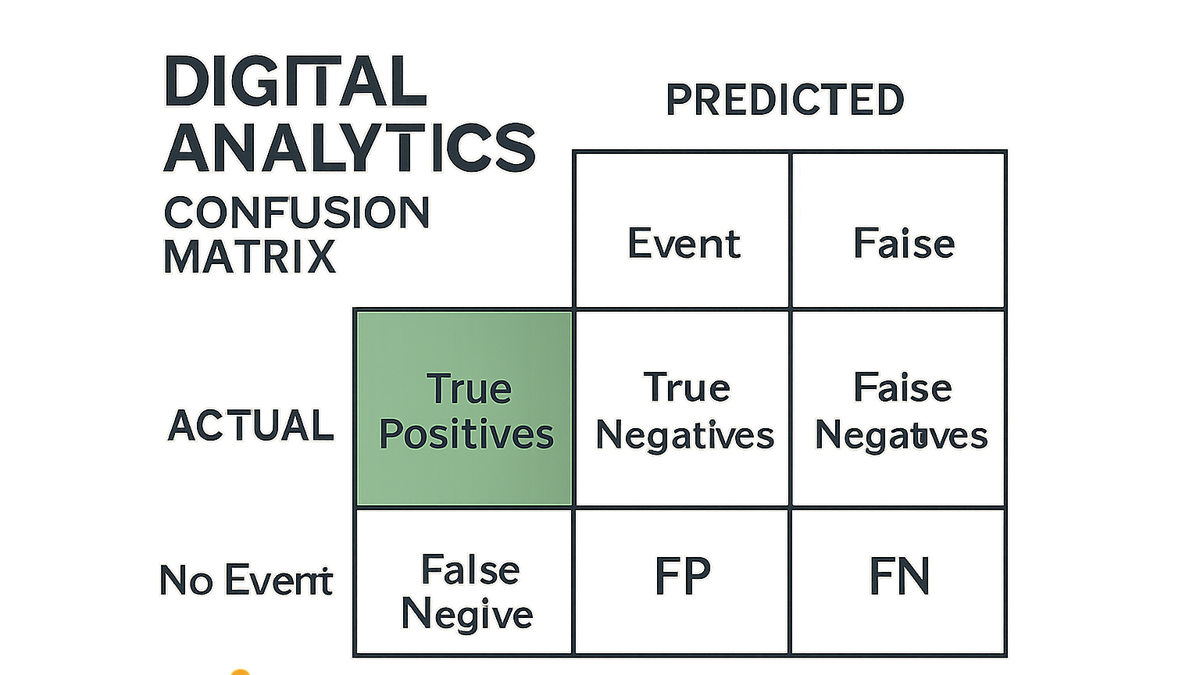
True positives (tp)
Events or conversions that truly occurred and were correctly recorded by your analytics tool.
-
False negatives (fn)
Events that actually occurred but were missed or not tracked by the system.
-
Tpr formula
The formula for True Positive Rate is:
TPR = TP / (TP + FN)
Importance of TPR in Analytics
A high TPR ensures that most genuine user actions are captured, supporting reliable decision-making. It is particularly vital when measuring low-volume events or high-value conversions where missing data can skew insights.
-
Accuracy of conversion tracking
Ensures your reported conversions match actual user behavior, preventing underestimation of campaign performance.
-
Quality of insights for optimization
High recall delivers more comprehensive data, enabling better A/B tests, personalization, and product adjustments.
-
Balancing with precision
Optimizing TPR alone can lead to more false positives. Balance recall with precision to avoid overcounting.
Calculating TPR in GA4
Google Analytics 4 doesn’t expose TPR directly, but you can derive it by combining event counts and user properties in Explorations or BigQuery.
-
Using GA4 explorations
Create a Free Form exploration with two metrics: “Event count” for your target event and a calculated metric for missed events. Then apply a custom formula to compute TPR.
-
Bigquery export
With GA4 data in BigQuery, run a SQL query to count TP and FN. For example:
SELECT
  SUM(CASE WHEN event_name = 'purchase' AND user_property_flag = TRUE THEN 1 ELSE 0 END) AS TP,
  SUM(CASE WHEN event_name = 'purchase' AND user_property_flag = FALSE THEN 1 ELSE 0 END) AS FN,
  SAFE_DIVIDE(TP, TP + FN) AS TPR
FROM `your_project.analytics_123456.events_*`;
Implementing TPR Tracking with PlainSignal
PlainSignal offers a lightweight, cookie-free analytics SDK. You can track events and calculate TPR offline or in your dashboard using the raw event data PlainSignal collects.
-
Setting up PlainSignal
Add the following snippet to your
<head>to start collecting event data without cookies:-
Example tracking code
<link rel="preconnect" href="//eu.plainsignal.com/" crossorigin />
<script defer data-do="yourwebsitedomain.com" data-id="0GQV1xmtzQQ" data-api="//eu.plainsignal.com" src="//cdn.plainsignal.com/plainsignal-min.js"></script>
-
Best Practices to Improve TPR
Optimizing TPR is an ongoing process. Regularly review tagging rules, test on multiple devices, and audit your data flows to catch missed events.
-
Refine event definitions
Ensure your event conditions accurately reflect the user actions you want to capture.
-
Use tag management rules
Leverage GTM or similar tools to manage triggers and reduce dropped tags due to misfires.
-
Conduct regular data audits
Compare analytics logs with backend or CRM records to spot discrepancies and missing events.