Published on 2025-06-26T04:21:28Z
What is User Experience (UX) Metrics? Examples for User Experience (UX) Metrics.
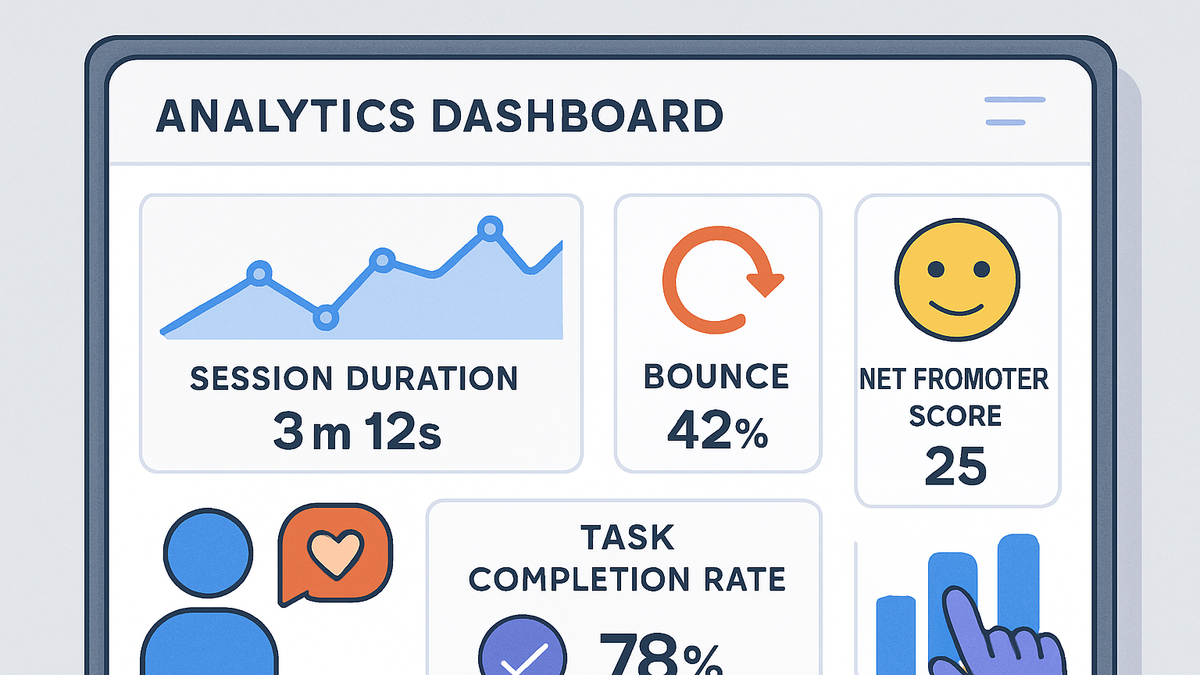
User Experience (UX) Metrics are quantitative measurements that assess how users interact with a website or application. They provide insights into satisfaction, efficiency, and usability, helping teams identify friction points and opportunities for improvement. Common UX metrics include Session Duration, Bounce Rate, and Net Promoter Score (NPS). Tools like PlainSignal (a cookie-free analytics platform) and Google Analytics 4 (GA4) enable tracking and analysis of these metrics. By integrating UX metrics into decision-making, organizations can optimize the user journey and drive higher engagement, retention, and conversions. UX metrics also help validate design hypotheses, prioritize feature development, and measure the impact of design changes over time.
User experience (ux) metrics
Quantitative measures like session duration, bounce rate, and NPS that assess and improve the usability and satisfaction of digital products.
Why UX Metrics Matter
User Experience (UX) metrics help teams understand how real users perceive and interact with a product. They highlight areas of friction, inform design decisions, and ultimately drive product success by aligning the user journey with business goals.
-
Improving user satisfaction
UX metrics reveal pain points in the user journey, enabling targeted improvements that boost satisfaction and loyalty.
-
Driving business outcomes
By linking UX metrics to conversion rates and retention, organizations can quantify the ROI of design initiatives.
Key UX Metrics
A core set of UX metrics provides insights into usability, engagement, and satisfaction across digital products. Monitoring these consistently can guide design and development priorities.
-
Session duration
Average time users spend during a single session, indicating engagement depth.
-
Bounce rate
Percentage of sessions where users leave after viewing only one page, reflecting potential usability or content issues.
-
Task completion rate
Ratio of users who successfully complete a defined task, measuring efficiency and clarity of the interface.
-
Net promoter score (nps)
A survey-based metric that gauges user loyalty by asking how likely they are to recommend the product to others.
-
System usability scale (sus)
A standardized questionnaire that provides a usability score based on user responses.
Tracking UX Metrics with Analytics Tools
Popular analytics platforms like PlainSignal and Google Analytics 4 (GA4) enable teams to collect, visualize, and analyze UX metrics. Below are examples of implementation and configuration.
-
Using PlainSignal
PlainSignal offers cookie-free, privacy-focused analytics for tracking fundamental UX metrics with minimal setup.
-
Implementation code
<link rel="preconnect" href="//eu.plainsignal.com/" crossorigin />
<script defer data-do="yourwebsitedomain.com" data-id="0GQV1xmtzQQ" data-api="//eu.plainsignal.com" src="//cdn.plainsignal.com/plainsignal-min.js"></script>
-
-
Using google analytics 4
GA4 tracks UX metrics through event-driven data collection. Enable Enhanced Measurement to auto-track pageviews, scrolls, outbound clicks, and more.
Best Practices for UX Metrics Analysis
To extract actionable insights, adopt a strategic approach when working with UX metrics. Focus on quality of data, context, and continuous improvement.
-
Set clear objectives
Align metrics with business and user goals to ensure that data collection drives meaningful actions.
-
Segment your audience
Analyze metrics across different user segments (e.g., new vs. returning, location, device) for deeper insights.
-
Combine quantitative and qualitative data
Augment numerical metrics with user interviews, heatmaps, and session recordings for a holistic view.
-
Iterate and validate
Regularly review metrics after product changes to validate improvements or identify new issues.