Published on 2025-06-28T04:40:27Z
What is ANOVA? Examples in Analytics
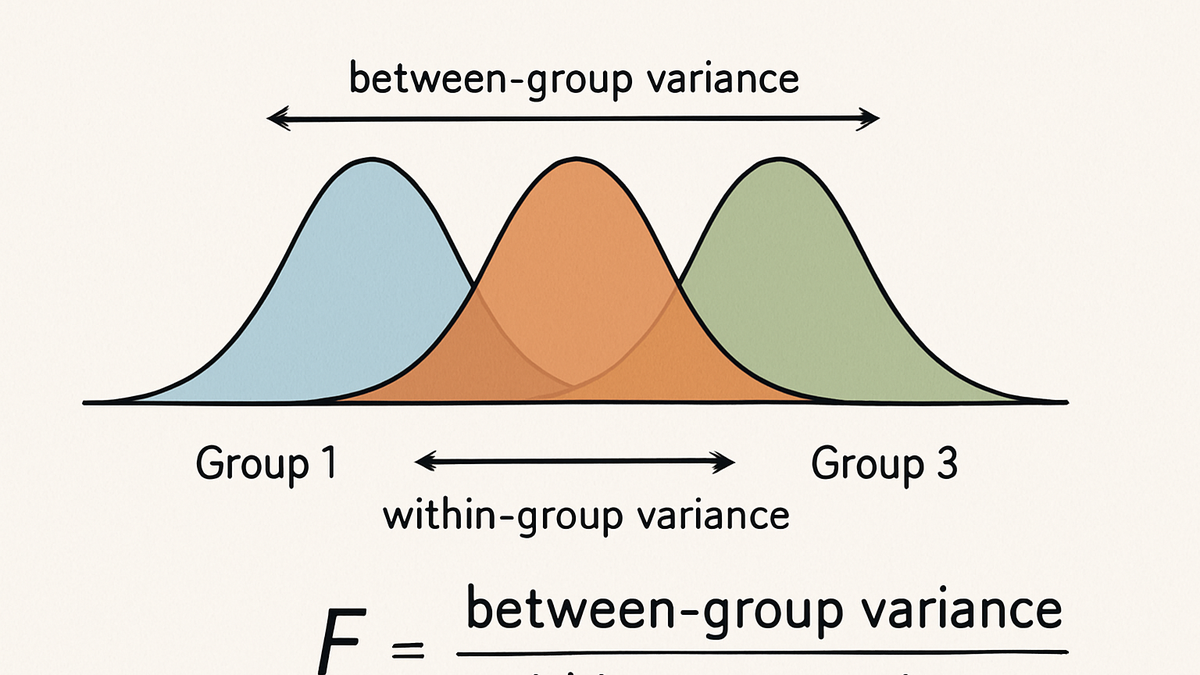
ANOVA, or Analysis of Variance, is a statistical technique used to determine whether the means of three or more groups differ significantly. In analytics, ANOVA helps compare metrics like conversion rate, session duration, or revenue across segments such as traffic sources, user cohorts, or experimental variants. Unlike multiple t-tests, ANOVA controls the overall Type I error rate, providing more reliable insights when testing more than two groups simultaneously. It works by partitioning total variance into between-group and within-group components and computing the F-statistic to assess significance. When ANOVA indicates a meaningful difference, post-hoc tests (e.g. Tukey’s HSD) identify which specific groups vary. Integrating ANOVA into workflows enhances A/B/n testing, segmentation analysis, and data-driven decision-making in tools like PlainSignal and Google Analytics 4.
Anova
Statistical method comparing the means of multiple groups to detect significant differences.
Overview of ANOVA in Analytics
ANOVA (Analysis of Variance) is a statistical method for testing whether the means of three or more groups differ. In analytics, it’s particularly useful for A/B/n testing and segment comparisons, offering a controlled way to assess multiple variants without inflating the chance of false positives.
-
Definition and use cases
ANOVA partitions variance into between-group and within-group components to compute the F-statistic, assessing if group means differ beyond random chance.
-
A/b/n testing
Compare more than two experimental variants (e.g., multiple landing page designs) in a single test.
-
Segmentation analysis
Evaluate metrics like conversion rate across different user segments such as traffic sources, devices, or demographics.
-
Types of ANOVA
ANOVA comes in several forms tailored to different experimental designs and factors.
-
One-way anova
Tests differences among group means for one categorical factor with three or more levels.
-
Two-way anova
Analyzes the effect of two independent factors and their interaction on a dependent variable.
-
Repeated measures anova
Used when the same subjects are measured under multiple conditions or over time.
Implementing ANOVA with Analytics Tools
How to set up and perform ANOVA using popular analytics platforms and programming libraries.
-
PlainSignal (cookie-free analytics)
To set up tracking for ANOVA analysis in PlainSignal, insert the following snippet into your HTML page:
<link rel='preconnect' href='//eu.plainsignal.com/' crossorigin /> <script defer data-do='yourwebsitedomain.com' data-id='0GQV1xmtzQQ' data-api='//eu.plainsignal.com' src='//cdn.plainsignal.com/plainsignal-min.js'></script> -
Google analytics 4 (GA4)
Google Analytics 4 doesn’t natively support multi-group ANOVA in the standard reports, but you have two main options:
-
Bigquery export
Export GA4 event data to BigQuery and run SQL-based ANOVA queries or connect BI tools for analysis.
-
GA4 explorations
Use the Explorations report to compare up to three segments and view basic statistical significance indicators.
-
-
Python & r libraries
Leverage statistical packages to perform ANOVA outside of your analytics dashboard. Example using SciPy in Python:
from scipy.stats import f_oneway # Suppose you have three groups of conversion rates group1 = [0.10, 0.12, 0.08] group2 = [0.15, 0.14, 0.13] group3 = [0.09, 0.11, 0.10] stat, p = f_oneway(group1, group2, group3) print('F={:.2f}, p={:.4f}'.format(stat, p))-
Scipy (python)
Imports f_oneway for one-way ANOVA tests in Python.
-
Statsmodels (python)
Provides anova_lm() for detailed ANOVA tables and formula syntax.
-
Aov() (r)
R’s built-in function for fitting one-way and multi-factor ANOVA models.
-
Interpreting ANOVA Results
Understanding the key outputs from an ANOVA test and next steps after finding significance.
-
Understanding the f-statistic
The F-statistic is the ratio of between-group variance to within-group variance; a higher F suggests greater differences among group means.
-
Assessing the p-value
The p-value indicates the probability of observing the data if the null hypothesis is true; a p-value below your alpha level (e.g. 0.05) signifies significant differences.
-
Conducting post-hoc tests
Performed after a significant ANOVA to pinpoint which specific group pairs differ.
-
Tukey's hsd
Controls the family-wise error rate when making all pairwise comparisons.
-
Bonferroni correction
Adjusts significance thresholds by dividing alpha by the number of comparisons to limit Type I errors.
-