Published on 2025-06-26T04:34:26Z
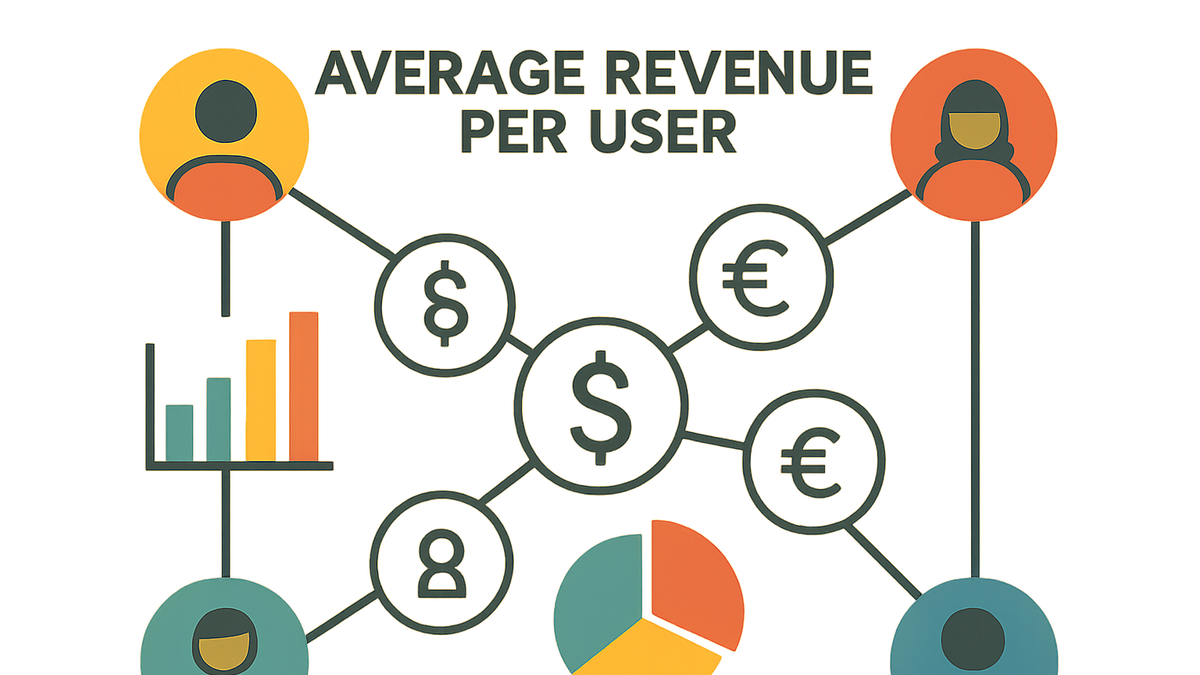
What is ARPSU? Average Revenue Per Single User
ARPSU (Average Revenue Per Single User) is a key performance indicator in digital analytics that measures the average revenue generated by each distinct user over a defined period. It provides a clear view of monetization efficiency by comparing revenue to user count. You calculate ARPSU by dividing total revenue by the number of unique users.
This metric is vital for subscription services, e-commerce sites, and any digital platform where user behavior drives revenue. By tracking ARPSU over time and across segments, teams can optimize pricing strategies, feature rollouts, and marketing efforts to maximize revenue per user.
Modern analytics tools like Google Analytics 4 (GA4) and PlainSignal (cookie-free analytics) support the capture of revenue events and user identifiers, making it straightforward to implement ARPSU tracking and visualization.
Arpsu
Average revenue generated per unique user in a given period, vital for measuring monetization and user value.
What is ARPSU?
In analytics, ARPSU stands for Average Revenue Per Single User (ARPSU). It measures the average revenue generated by each unique user over a specified time frame. This section breaks down its definition and core components.
-
Definition
ARPSU calculates the average revenue contributed by a single user in a specified period.
-
Formula
ARPSU = Total Revenue ÷ Number of Unique Users
-
-
Key components
ARPSU relies on two main data points: total revenue and unique user count.
-
Total revenue
The sum of all revenue streams (purchases, subscriptions, ad revenue) within the period.
-
Unique users
Distinct users identified by cookies, user IDs, or other persistent identifiers.
-
Why ARPSU Matters in Analytics
Understanding ARPSU helps businesses gauge monetization efficiency and compare performance across segments, products, or time periods.
-
Measure monetization efficiency
Shows how effectively the product turns users into revenue, highlighting upsell and pricing opportunities.
-
Benchmark growth
Allows comparison of revenue performance over time or between different cohorts to track growth.
-
Segment analysis
Facilitates deeper insights by comparing ARPSU across various user segments.
-
Channel segments
Compare ARPSU for users acquired via different marketing channels.
-
User cohorts
Analyze ARPSU for cohorts based on sign-up date, geography, or behavior.
-
How to Calculate ARPSU
Calculating ARPSU involves gathering revenue data and user counts then applying a simple formula.
-
Gather total revenue
Sum all revenue sources within the chosen period.
-
Identify unique users
Count distinct user identifiers active during the same period.
-
Apply the formula
Divide total revenue by the number of unique users to get ARPSU.
-
Sample calculation
If total revenue is \(50,000 and there are 2,000 users, ARPSU = \)50,000 ÷ 2,000 = $25.
-
Implementing ARPSU Tracking with SaaS Tools
Key steps to capture the data needed for ARPSU using GA4 and PlainSignal.
-
GA4 implementation
Google Analytics 4 doesn’t include ARPSU out of the box, but you can send revenue events and compute the metric in Explorations or BigQuery.
-
Send revenue events
Use the gtag.js snippet to dispatch purchase events with
valueandcurrencyparameters. -
Define custom metric
In GA4, set up a custom metric or use Explorations to divide total revenue by user count.
-
Example code
<script async src="https://www.googletagmanager.com/gtag/js?id=G-XXXXXXXXXX"></script>
<script>
  window.dataLayer = window.dataLayer || [];
  function gtag(){dataLayer.push(arguments);}
  gtag('js', new Date());
  gtag('config', 'G-XXXXXXXXXX');
  gtag('event', 'purchase', { value: 99.99, currency: 'USD' });
</script>
-
-
PlainSignal implementation
PlainSignal offers cookie-free analytics; embed the script and configure revenue events to capture ARPSU data.
-
Embed tracking snippet
Drop the PlainSignal tag into your site’s
<head>element to start capturing data. -
Configure revenue tracking
Use PlainSignal’s event API to send revenue and user identification data.
-
Example code
<link rel="preconnect" href="//eu.plainsignal.com/" crossorigin />
<script defer data-do="yourwebsitedomain.com" data-id="0GQV1xmtzQQ" data-api="//eu.plainsignal.com" src="//cdn.plainsignal.com/plainsignal-min.js"></script>
-
-
Data validation
Ensure data accuracy by validating revenue totals and user counts against your billing system and other analytics tools.
-
Cross-tool reconciliation
Compare ARPSU inputs from GA4, PlainSignal, and your backend database to identify discrepancies.
-
Best Practices and Common Pitfalls
Guidelines to ensure reliable ARPSU measurement and avoid common errors.
-
Time period consistency
Always align the date ranges for revenue and user counts to avoid skewed ARPSU values.
-
Fixed date intervals
Use consistent intervals (e.g., weekly, monthly) for reporting and comparisons.
-
-
Handling refunds and cancellations
Incorporate refunds and cancellations into your revenue totals to reflect net revenue.
-
Net revenue adjustment
Subtract refunded amounts from total revenue before calculating ARPSU.
-
-
Avoiding duplicate users
Use stable user identifiers to prevent counting the same person multiple times across devices or sessions.
-
Authenticated ids
Implement user authentication to assign persistent IDs rather than relying solely on cookies.
-