Published on 2025-06-27T21:49:53Z
What Are Baseline Metrics? Examples and Applications
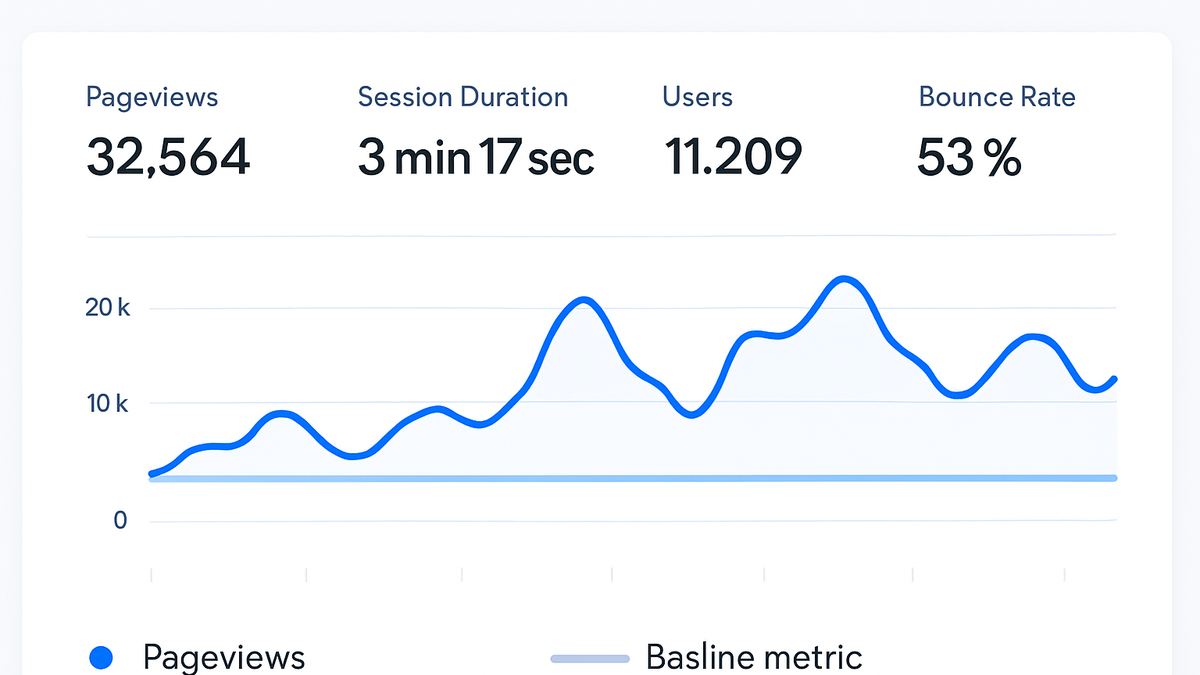
Baseline metrics are the initial measurements that capture the current state of your website or application’s performance before any changes are made. They serve as a reference point—or benchmark—for evaluating the effectiveness of future optimizations, experiments, and marketing campaigns. Without a clear baseline, it’s impossible to determine whether an increase in traffic, conversions, or engagement is a result of your efforts or simply part of natural fluctuations. Establishing robust baseline metrics involves identifying the most relevant key performance indicators (KPIs), collecting data over a representative period, and documenting those values for ongoing comparison. By regularly reviewing and updating these baselines, teams can maintain accurate benchmarks that reflect evolving user behavior, seasonal trends, and product updates.
Baseline metrics
Initial reference metrics serving as benchmarks to gauge performance changes, trends, and experiment outcomes.
Why Baseline Metrics Matter
Baseline metrics establish a performance benchmark that teams can use to evaluate the impact of changes, campaigns, and experiments. They provide the context needed to distinguish meaningful improvements from normal fluctuations and seasonality. Without a clear baseline, even the most sophisticated analytics efforts can lead to misleading conclusions. By defining and documenting these reference points, businesses can set achievable goals and measure progress accurately over time.
-
Performance benchmarking
Use baseline metrics to compare current performance against historical data or industry standards, ensuring objective assessments.
-
Goal setting
Baseline data help you establish realistic targets aligned with your business objectives and track whether you’re meeting those goals.
-
Trend analysis
Monitoring deviations from baseline over time uncovers seasonal patterns, anomalies, and long-term trends that inform strategic decisions.
How to Establish Baseline Metrics
Creating a reliable baseline involves choosing the right KPIs, collecting accurate data, and documenting your initial findings. Start by aligning your metrics with business goals—whether that’s traffic, engagement, or revenue. Collect data over a representative period (e.g., two to four weeks) to capture typical variations and avoid skewed results. Make sure your tracking code is implemented correctly across all pages or screens. Finally, record these initial values and store them securely for future comparisons as your product and user base evolve.
-
Identify key metrics
Choose metrics that directly reflect your objectives, such as pageviews for traffic, session duration for engagement, and conversion rate for transactions.
-
Business objectives
Ensure every selected metric ties back to a strategic goal to maintain focus and relevance.
-
User behavior indicators
Select metrics that accurately capture how users interact with your site or app.
-
-
Gather representative data
Collect data over a sufficient time frame to account for regular fluctuations like weekends or seasonality.
-
Implement accurate tracking
Ensure your analytics snippet is correctly installed on every page or view to prevent data gaps and inaccuracies.
Examples of Baseline Metrics Using SaaS Tools
Here’s how you can establish and view baseline metrics using popular analytics platforms like PlainSignal and Google Analytics 4 (GA4). Each tool offers unique features to record your initial performance benchmarks safely and accurately.
-
PlainSignal
PlainSignal is a cookie-free analytics solution that emphasizes simplicity and privacy. To begin tracking baseline metrics, insert the PlainSignal script into your HTML as follows:
<link rel="preconnect" href="//eu.plainsignal.com/" crossorigin />
<script defer data-do="yourwebsitedomain.com" data-id="0GQV1xmtzQQ" data-api="//eu.plainsignal.com" src="//cdn.plainsignal.com/plainsignal-min.js"></script>
Then log in to your PlainSignal dashboard to view baseline pageviews, unique visitors, and session duration. You can export these initial figures or set up regular reports.
-
Google analytics 4 (GA4)
In GA4, navigate to the Admin panel and ensure your GA4 property is set up with the gtag.js or Google Tag Manager snippet. After data collection begins, go to Reports > Engagement to view metrics like average engagement time and event counts. Record the figures from your first week of data as your baseline and export them to a spreadsheet for future comparison.
Best Practices for Baseline Metrics
Maintaining useful baseline metrics over time requires regular review, segmentation, and clear documentation. Adopt these best practices to ensure your benchmarks stay relevant and actionable.
-
Regularly update baselines
Review and adjust your baseline metrics periodically (e.g., quarterly) to reflect changes in user behavior, product updates, or market trends.
-
Segment your data
Break down baseline metrics by segments—such as geography, device type, or traffic source—to uncover deeper insights and set more targeted benchmarks.
-
Document assumptions
Record the conditions under which baselines were established (date range, user segments, site versions) to maintain clarity and reproducibility.