Published on 2025-06-27T19:37:21Z
What is Churn Probability? Examples for Churn Probability
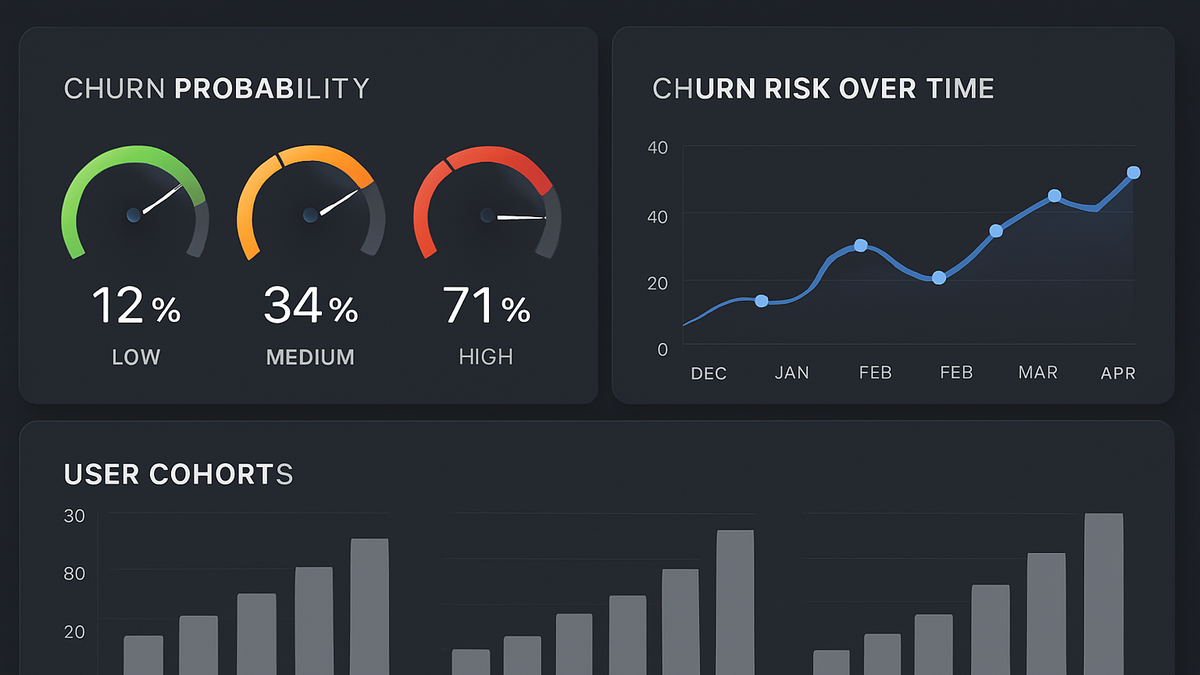
Churn probability is a predictive analytics metric that quantifies the likelihood of an individual user ceasing to engage with a service within a given timeframe. It differs from the historical churn rate by offering a forward-looking, probabilistic assessment rather than a retrospective percentage. To calculate churn probability, businesses analyze behavioral data—such as session frequency, feature usage, and support interactions—and apply statistical or machine learning models. High churn probability scores signal users at risk of departure, enabling targeted retention campaigns and informed revenue forecasting. Analytics tools like Google Analytics 4 provide built-in churn predictions, while cookie-free platforms such as PlainSignal allow for custom model integration without compromising user privacy.
Churn probability
Forward-looking metric estimating a user's likelihood to disengage, guiding targeted retention and revenue forecasts.
Importance of Churn Probability
Churn probability is essential for proactive customer retention and revenue planning. By predicting which users are most likely to leave, businesses can allocate resources effectively and tailor interventions to reduce attrition.
-
Defining churn probability
Churn probability measures the likelihood that an individual user will cease engagement within a specified period. Unlike churn rate which looks backward, churn probability is forward-looking and probabilistic.
-
Probability vs. rate
Churn rate calculates the percentage of users lost over a period, while churn probability estimates the chance of a single user churning.
-
Time frames
Models can predict churn over various horizons (for example, 7, 30, or 90 days), affecting how businesses plan retention efforts.
-
-
Business impact
Understanding churn probability helps prioritize retention resources, forecast revenue, and improve customer lifetime value.
-
Revenue forecasting
By aggregating individual churn probabilities, finance teams can predict potential revenue losses.
-
Targeted retention campaigns
Marketing can segment high-risk users and tailor outreach to reduce churn.
-
Calculating Churn Probability
Accurate churn probability relies on robust statistical or machine learning models fed by quality data. Organizations choose methods based on data volume, complexity, and interpretability requirements.
-
Statistical and machine learning models
Common approaches include logistic regression, decision trees, random forests, and survival analysis to model churn probability.
-
Logistic regression
A baseline model that predicts binary outcomes and outputs probabilities of churn.
-
Survival analysis
Techniques like Kaplan-Meier estimators and the Cox proportional hazards model time-to-churn events.
-
-
Data requirements
Effective churn models need quality data on user behavior, demographics, and historical churn events.
-
Behavioral data
Session frequency, feature usage, and engagement metrics inform risk factors.
-
Customer attributes
Demographics, subscription plans, and support interactions can improve model accuracy.
-
Tracking with Analytics Tools
Leverage platforms like Google Analytics 4 and PlainSignal to collect and analyze data for churn probability modeling. Each tool offers unique capabilities and trade-offs.
-
Google analytics 4 (GA4)
GA4 offers built-in predictive metrics such as predicted_churn_probability for purchaser audiences.
-
Setup predictive metrics
Enable predictive audiences in GA4 and define criteria for churn risk segments.
-
Limitations
GA4’s predictive models are black-box and may not cover all use cases or customer cohorts.
-
-
PlainSignal
PlainSignal provides cookie-free, event-based tracking that can feed custom churn probability models.
-
Cookie-free tracking
Collects user events without third-party cookies, improving privacy compliance.
-
Custom model integration
Export event data via API or webhook to train your own churn models.
-
Implementing Churn Probability Tracking
Integrate the necessary tracking code and set up dashboards to monitor churn probability. Visualizing risk trends and alerts helps teams respond quickly.
-
Integration snippet example
Add the PlainSignal tracking snippet to your site’s head to start collecting events. Learn more from the example code below.
-
Example code
<link rel="preconnect" href="//eu.plainsignal.com/" crossorigin /> <script defer data-do="yourwebsitedomain.com" data-id="0GQV1xmtzQQ" data-api="//eu.plainsignal.com" src="//cdn.plainsignal.com/plainsignal-min.js"></script> -
Placement
Place this snippet in the <head> section of all pages to ensure complete event capture.
-
-
Dashboards and alerts
Visualize churn probability trends and set alerts for significant changes in risk levels.
-
Visualization
Use line charts for cohort risk and heatmaps for segment comparisons.
-
Threshold alerts
Configure alerts when average churn probability exceeds set thresholds.
-
Best Practices and Pitfalls
Ensure reliability and ethical use of churn probability by following best practices and avoiding common mistakes.
-
Ensuring data quality
High-quality data underpins accurate churn predictions.
-
Data completeness
Ensure all relevant events, including inactivity signals, are tracked.
-
Data consistency
Maintain consistent naming conventions and schema versioning across implementations.
-
-
Ethical and privacy considerations
Respect user privacy when collecting data and predicting behavior.
-
Gdpr and ccpa compliance
Obtain proper consent before tracking personal data for predictive models.
-
Transparency
Inform users how their data is used and offer easy opt-out options.
-