Published on 2025-06-26T04:29:30Z
What are Cohorts? Examples for Cohort Analysis
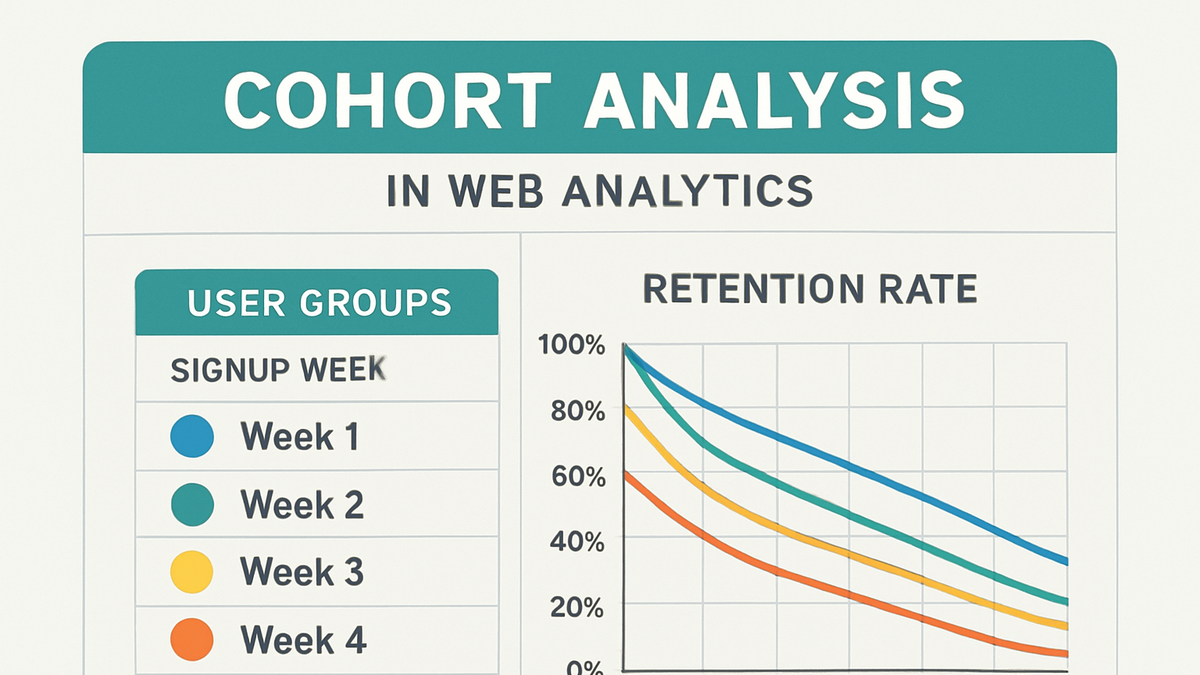
Cohort analysis in analytics refers to grouping users based on shared characteristics or behaviors within a specific time period to study how these groups evolve over time. It is particularly useful for measuring user retention, engagement, and the long-term impact of new features or marketing campaigns. By examining cohorts—such as users who signed up in the same week—teams can compare performance metrics like retention rate or revenue, identify trends, and uncover hidden patterns. Leading SaaS platforms like Google Analytics 4 (GA4) provide built-in cohort reporting, while PlainSignal offers a privacy-focused, cookie-free alternative with a minimal JavaScript snippet. Effective cohort analysis enables data-driven decision-making, helping businesses optimize user experience, marketing ROI, and product development strategies.
Cohorts
Grouping users based on a common attribute or timeframe to analyze behavior, retention, and trends over time.
Introduction to Cohorts
An overview of what cohorts are and why they are used in analytics.
-
Definition of a cohort
A cohort is a group of users who share a common characteristic or perform the same action within a specific time frame.
-
Types of cohorts
Cohorts can be classified by time (e.g., users who signed up in the same month) or by behavior (e.g., users who completed a purchase).
-
Time-based cohorts
Groups users based on when they first interact, such as the day or week of signup.
-
Behavior-based cohorts
Groups users by specific actions or events they perform, like making a purchase or viewing a feature.
-
Importance of Cohort Analysis
Examines the key benefits of analyzing cohorts for retention, engagement, and growth insights.
-
Tracking user retention
Cohort analysis reveals how many users return after their initial interaction, highlighting retention trends over time.
-
Identifying engagement patterns
Comparing cohorts shows how user behavior evolves, helping to pinpoint features that drive usage.
-
Measuring growth impact
Analyzing cohorts across different acquisition channels uncovers which campaigns deliver high-quality users.
Cohort Features in GA4 and PlainSignal
Compares how major analytics platforms implement cohort analysis.
-
GA4 cohort reports
Google Analytics 4 provides built-in cohort analysis with flexible time windows, dimensions, and metrics.
-
Acquisition cohorts
Groups users by the date they were acquired.
-
Retention metrics
Tracks user return rates over days, weeks, or months.
-
-
PlainSignal cohort insights
PlainSignal offers a lightweight, cookie-free script that automatically generates cohort data, focusing on privacy and simplicity.
-
Implementation differences
GA4 uses an event-based data model requiring configuration in the UI, while PlainSignal relies on a snippet for automatic data collection.
Implementing Cohort Analysis in PlainSignal
Shows how to set up PlainSignal for cohort tracking on your website.
-
Setup instructions
Sign up for PlainSignal, add your site domain in the dashboard, and obtain the tracking script details.
-
Sample tracking code
Include the following snippet in your HTML to enable PlainSignal cohort tracking:
<link rel="preconnect" href="//eu.plainsignal.com/" crossorigin />
<script defer data-do="yourwebsitedomain.com" data-id="0GQV1xmtzQQ" data-api="//eu.plainsignal.com" src="//cdn.plainsignal.com/plainsignal-min.js"></script>
Best Practices for Cohort Analysis
Guidelines to maximize the effectiveness of cohort analysis.
-
Define clear cohort criteria
Select meaningful timeframes or behaviors that align with your business goals.
-
Review cohorts regularly
Analyze cohort reports on a consistent schedule to detect changes or anomalies promptly.
-
Combine cohorts with segments
Use segmentation to filter cohorts by attributes like geography or device for deeper insights.