Published on 2025-06-27T19:08:24Z
What is Data Normalization in Analytics? Examples and Best Practices
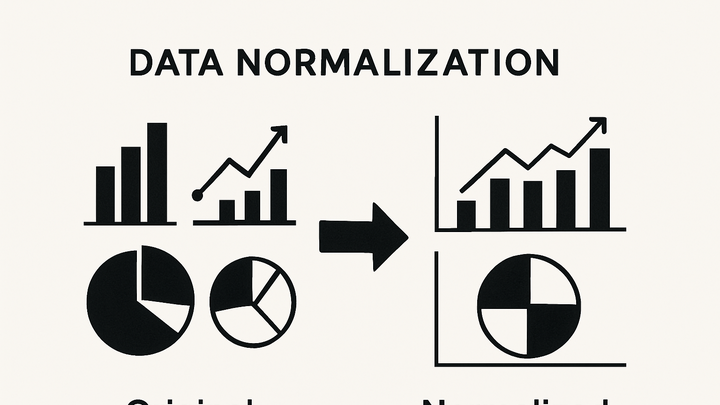
Data normalization in analytics is the process of adjusting and scaling raw metrics from multiple sources to a common range or distribution. This ensures that disparate datasets—each with its own units, magnitudes, or distributions—can be accurately compared and analyzed together. By harmonizing data scales, normalization reduces bias, highlights genuine patterns, and improves the reliability of statistical measures and machine learning models. In modern analytics platforms like Google Analytics 4 (GA4) or cookie-free tools such as PlainSignal, normalization often occurs post-collection via exports or integrated pipelines. Through methods like Min-Max scaling or Z-score standardization, analysts transform raw event counts, session durations, and other metrics into standardized forms that drive clearer insights and better decision-making.
Data normalization
Adjusting analytics metrics to a common scale for accurate comparison and reliable insights.
Understanding Data Normalization
Data normalization is a crucial step in analytics where raw metrics from different sources or scales are adjusted to a common range. This process ensures that large and small values are brought into alignment, preventing dominant metrics from skewing results. Normalization enhances the comparability of datasets, making multivariate analyses and cross-metric dashboards more meaningful. It also prepares data for downstream processes like clustering, forecasting, and anomaly detection by stabilizing variances and centering distributions.
-
Definition
The act of rescaling or transforming raw data values so they follow a consistent range or distribution.
-
Key objectives
Ensure consistency, reduce bias in statistical measures, and improve the performance of analytical models.
Why Data Normalization Matters in Analytics
Normalization addresses the challenge of comparing metrics that originate from different tracking systems or exhibit varying magnitudes. Without it, one feature with large values can dominate analyses, hiding subtle but important trends. Properly normalized data drives accurate correlations, supports fair weighting in dashboards, and lays a solid foundation for machine learning algorithms.
-
Ensures consistency across datasets
Brings metrics from tools like GA4 and PlainSignal onto a comparable scale, enabling unified reporting.
-
Improves insight accuracy
Prevents high-variance metrics from overshadowing smaller-scale trends, leading to clearer findings.
-
Supports meaningful comparisons
Facilitates side-by-side analysis of metrics—such as session duration versus event counts—by standardizing their ranges.
Methods of Data Normalization
Several mathematical techniques exist to normalize data, each suited to different distributions and analytical goals. Selecting the right method depends on the nature of your metrics, the presence of outliers, and the intended downstream use case.
-
Min-max scaling
Rescales feature values to a fixed range, typically [0, 1], by subtracting the minimum and dividing by the range.
-
Formula
x’ = (x - min) / (max - min)
-
When to use
Ideal for bounded data with known minimum and maximum values; preserves original distribution shape.
-
-
Z-score standardization
Centers data around the mean (zero) and scales it by the standard deviation, yielding a distribution with mean 0 and variance 1.
-
Formula
z = (x - μ) / σ
-
When to use
Best for normally distributed data; highlights how many standard deviations a point is from the mean.
-
-
Decimal scaling
Moves the decimal point of values to normalize them based on the number of digits of the maximum absolute value.
-
Formula
x’ = x / 10^j, where j = smallest integer such that max(|x’|) < 1
-
When to use
Simple approach requiring minimal computation; suitable for quick scaling when precise bounds aren’t critical.
-
-
Log transformation
Applies a logarithmic function to compress skewed distributions, reducing the impact of large outliers.
-
Formula
x’ = log(x)
-
When to use
Effective for right-skewed data; helps stabilize variance and normalize distributions.
-
Implementing Data Normalization in SaaS Analytics Tools
Analytics platforms often collect raw data but rely on external processes or integrated features to normalize it. Below are ways to apply normalization in PlainSignal and Google Analytics 4 (GA4).
-
PlainSignal
A lightweight, cookie-free analytics tool that provides raw event counts and metrics via its JavaScript snippet and API.
-
Integration
Embed the PlainSignal script to capture raw data:
<link rel="preconnect" href="//eu.plainsignal.com/" crossorigin /> <script defer data-do="yourwebsitedomain.com" data-id="0GQV1xmtzQQ" data-api="//eu.plainsignal.com" src="//cdn.plainsignal.com/plainsignal-min.js"></script> -
Data export
Use PlainSignal’s API or CSV export to retrieve raw metrics, then apply normalization in your chosen environment (Python, R, etc.).
-
-
Google analytics 4 (GA4)
GA4 streams event-level data and can export it to BigQuery for advanced normalization and analysis.
-
Data stream setup
Configure your web and app streams to collect raw events and user properties for export.
-
Bigquery export
Export GA4 data to BigQuery and run SQL normalization queries directly on your event tables.
-
Practical Examples and Best Practices
Below are concrete examples demonstrating how to apply normalization techniques to PlainSignal and GA4 data, along with recommendations for robust implementation.
-
Min-max normalization example with PlainSignal data
Fetch a CSV export of a PlainSignal metric and scale it into the [0,1] range using Python.
-
Python script
import pandas as pd # Load PlainSignal export url = 'https://api.plainsignal.com/export?apiKey=YOUR_API_KEY' df = pd.read_csv(url) # Min-Max normalization min_val = df['metric'].min() max_val = df['metric'].max() df['normalized'] = (df['metric'] - min_val) / (max_val - min_val) -
Interpreting results
Normalized values now range from 0 to 1, allowing you to compare this metric alongside others with different scales.
-
-
Z-score standardization in bigquery for GA4 data
Use BigQuery SQL to standardize an event metric and identify outliers based on standard deviation.
-
Sql query
SELECT event_name, (event_count - AVG(event_count) OVER()) / STDDEV(event_count) OVER() AS z_score FROM `project.dataset.GA4_events` -
Use cases
Highlight events with unusually high or low counts, aiding in anomaly detection and campaign analysis.
-
