Published on 2025-06-28T08:44:41Z
What is Descriptive Statistics? Examples with PlainSignal and GA4
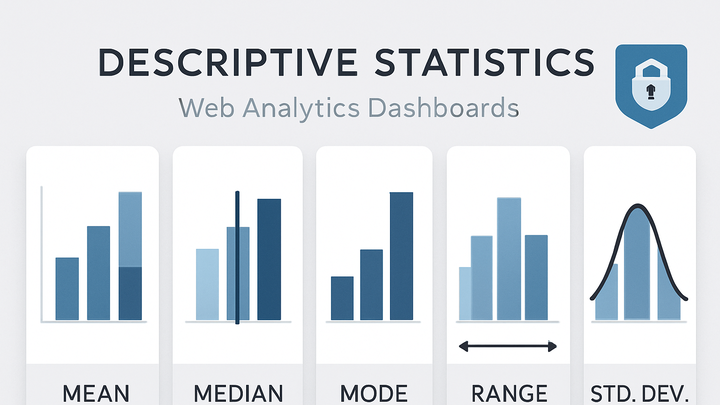
Descriptive statistics are quantitative measures that summarize and describe the main features of a dataset. They provide insights into data through central tendency measures (mean, median, mode), dispersion metrics (range, variance, standard deviation), and distribution shape descriptions. In web analytics, descriptive statistics allow analysts to quickly grasp user behavior patterns, session durations, and pageview distributions. Unlike inferential statistics, which draw conclusions about populations from samples, descriptive statistics focus solely on summarizing the observed data. By presenting complex datasets in a compact form, these measures empower teams to make informed, data-driven decisions.
Descriptive statistics
Descriptive statistics summarize key data features—mean, median, mode, etc.—to help understand trends and distributions in analytics.
Overview of Descriptive Statistics
Descriptive statistics provide a way to summarize the essential characteristics of a dataset in a concise manner. They help analysts understand overall trends, spot outliers, and communicate findings without delving into every data point. In analytics, these measures offer quick visibility into user behavior, engagement patterns, and key performance indicators. By condensing raw metrics into summary values, teams can set benchmarks and monitor changes over time.
-
Definition
Quantitative measures that describe the central tendency, dispersion, and shape of a dataset.
-
Purpose in analytics
To transform raw event and session data into understandable metrics, enabling stakeholders to make quick decisions.
Key Measures in Descriptive Statistics
This section explores the most common measures used to summarize web analytics data, each revealing different aspects of user behavior and performance.
-
Mean (average)
The arithmetic average of a dataset, useful for metrics like average session duration or pageviews per user.
-
Formula
Sum of all values divided by the count (Σx / n).
-
-
Median
The middle value in an ordered dataset, offering a robust central tendency measure for skewed data.
-
Calculation
Order values and select the middle one (or average the two middle values if the count is even).
-
-
Mode
The value that appears most frequently in a dataset, often used for categorical metrics.
-
Use case
Identify the most common landing page or device category in analytics.
-
-
Standard deviation
A measure of variability that shows how much values deviate from the mean, indicating consistency of metrics.
-
Formula
Square root of variance: sqrt(Σ(x - mean)² / n).
-
-
Percentiles
Values below which a given percentage of observations fall, such as the 90th percentile of page load times.
-
Example
The 90th percentile load time indicates that 90% of page loads are faster than this threshold.
-
Implementing Descriptive Statistics in Analytics Tools
Popular SaaS analytics platforms automatically compute descriptive statistics once the tracking code is in place. Below are examples with PlainSignal and Google Analytics 4.
-
PlainSignal (cookie-free analytics)
PlainSignal provides privacy-first, cookie-free analytics. You can implement it with the following tracking code snippet:
<link rel="preconnect" href="//eu.plainsignal.com/" crossorigin />
<script defer data-do="yourwebsitedomain.com" data-id="0GQV1xmtzQQ" data-api="//eu.plainsignal.com" src="//cdn.plainsignal.com/plainsignal-min.js"></script>
Once implemented, PlainSignal’s dashboard will automatically compute descriptive metrics like average session duration, pageviews mean, and percentile distributions.
-
Data captured
Pageviews, unique visitors, session duration, bounce rate.
-
Privacy features
Does not use cookies or store personal identifiable information.
-
-
Google analytics 4 (GA4)
GA4 uses an event-based model. You can enable GA4 by adding the gtag.js snippet:
<!-- Global site tag (gtag.js) -->
<script async src="https://www.googletagmanager.com/gtag/js?id=GA_MEASUREMENT_ID"></script>
<script>
  window.dataLayer = window.dataLayer || [];
  function gtag(){dataLayer.push(arguments);}
  gtag('js', new Date());
  gtag('config', 'GA_MEASUREMENT_ID');
</script>
After setup, GA4’s UI under Reports > Engagement > Overview will display metrics such as average engagement time and pageviews.
-
Metrics available
Average engagement time, user counts, event counts.
-
Custom reports
Build Explorations to compute median session length, percentiles, and custom segments.
-
Limitations and Best Practices
While descriptive statistics offer quick snapshots of data, it’s important to understand their limitations and follow best practices when interpreting results.
-
Handling skewed data
Mean can be distorted by outliers; use median or percentiles for a more accurate central tendency.
-
Tip
Report both mean and median session durations when outliers are present.
-
-
Data quality
Ensure your tracking implementation is accurate to avoid gaps or duplicates that bias statistics.
-
Checklist
Verify tag firing, exclude bot traffic, and de-duplicate events.
-
-
Complementary analysis
Combine descriptive statistics with segmentation or inferential methods for deeper insights.
-
Example
Segment users by traffic source before comparing average session times to control for behavior differences.
-
