Published on 2025-06-22T03:12:33Z
What is Error Rate? Examples and Best Practices
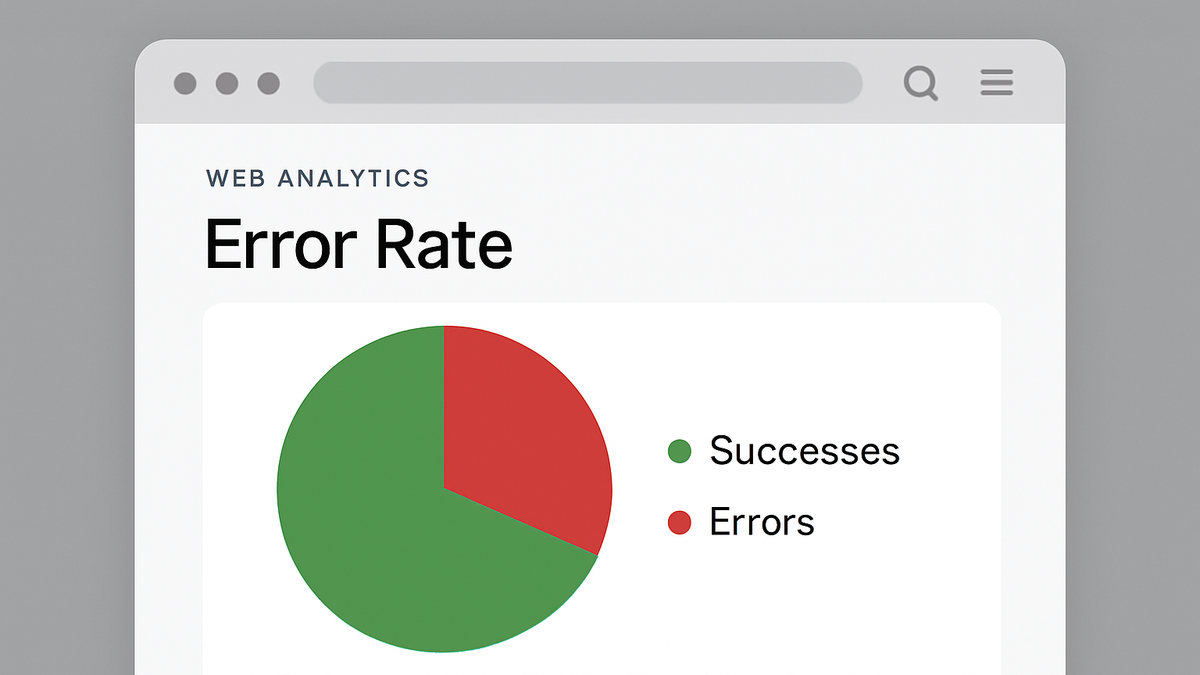
Error Rate in analytics refers to the percentage of tracking requests that fail or return errors, causing data loss or inaccuracies. It is a crucial metric for assessing the reliability of your tracking setup in tools like Google Analytics 4 (GA4) or privacy-conscious SaaS platforms such as PlainSignal. A high error rate can skew key metrics—like pageviews, sessions, and conversion rates—leading to misinformed business decisions. Common causes include misconfigured JavaScript tags, ad blockers, stringent content security policies, network issues, or incorrect endpoint URLs. Monitoring your error rate helps ensure robust data collection and accurate reporting.
Below is an example of integrating PlainSignal (cookie-free simple analytics) tracking code:
<link rel='preconnect' href='//eu.plainsignal.com/' crossorigin />
<script defer data-do='yourwebsitedomain.com' data-id='0GQV1xmtzQQ' data-api='//eu.plainsignal.com' src='//cdn.plainsignal.com/plainsignal-min.js'></script>
You can also monitor errors in GA4’s DebugView to identify failed hits.
Error rate
The percentage of failed tracking requests in analytics, indicating data collection reliability.
How Error Rate is Calculated
This section explains the formula and rationale behind calculating the error rate in web analytics.
-
Calculation formula
The error rate is calculated as (Failed Tracking Requests / Total Tracking Requests) × 100.
This percentage quantifies the proportion of analytics hits that did not successfully reach the server or were rejected, providing insight into data collection health.
Common Causes of Tracking Errors
Identifying why tracking requests fail helps you proactively address issues and reduce the error rate.
-
Javascript tag issues
Incorrect tag placement, syntax errors, or missing script dependencies can prevent the analytics script from executing.
-
Typographical errors
Misspelled attributes or missing characters in the
<script>tag can break the tracking code. -
Improper tag order
Loading analytics tags before required libraries or dependencies causes execution failures.
-
-
Network and server errors
Network timeouts, DNS failures, or server-side misconfigurations can lead to HTTP 4xx/5xx status codes.
-
Server downtime
Temporary unavailability of the analytics endpoint causes request failures.
-
Cors policy restrictions
Missing or misconfigured CORS headers block cross-origin tracking requests.
-
-
Ad blockers and privacy tools
Browser extensions and privacy-focused browsers can block known analytics domains or scripts.
-
Domain blocklists
Lists of blocked domains prevent the analytics script from downloading.
-
Script injection prevention
Some tools detect and block inline or external scripts deemed unsafe.
-
Impact of Error Rate on Analytics
Understanding how a high error rate distorts analytics data underscores the importance of monitoring and reducing it.
-
Data accuracy
Underreported pageviews, sessions, and conversion events lead to incorrect KPI measurements and flawed business insights.
-
Reporting consistency
Different error distributions across pages or browsers can produce inconsistent reports between analytics tools.
Best Practices to Reduce Error Rate
Implementing robust tracking strategies and monitoring tools can minimize the frequency of tracking errors.
-
Use a cdn and fallbacks
Host analytics scripts on reliable CDNs and configure fallback URLs to ensure script availability.
-
Monitor network requests
Regularly review browser DevTools or server logs to detect and troubleshoot failed analytics hits.
-
Implement tag testing tools
Leverage tools like Google Tag Assistant, GA4 DebugView, or PlainSignal’s debug mode to validate tag execution.
-
Adopt server-side tracking
Shift critical hit sending to server endpoints to bypass client-side blockers and reduce client-side errors.