Published on 2025-06-26T04:43:08Z
What is Experiment Design in Analytics? Examples and Best Practices
In analytics, Experiment Design is the process of planning and structuring tests or experiments to evaluate the impact of changes on key metrics. It involves defining hypotheses, selecting variables, determining sample sizes, and randomizing participant assignment to ensure statistically valid results. Well-designed experiments help organizations make data-driven decisions, minimize risk, and optimize user experiences. This article explores the principles of Experiment Design in web analytics and illustrates implementation using tools like PlainSignal (a cookie-free simple analytics platform) and Google Analytics 4 (GA4).
Example implementation with PlainSignal:
<link rel="preconnect" href="//eu.plainsignal.com/" crossorigin />
<script defer data-do="yourwebsitedomain.com" data-id="0GQV1xmtzQQ" data-api="//eu.plainsignal.com" src="//cdn.plainsignal.com/plainsignal-min.js"></script>
In GA4, configure an event for variant exposure:
gtag('event', 'experiment_view', {
  'experiment_id': 'exp123',
  'variant': 'A'
});
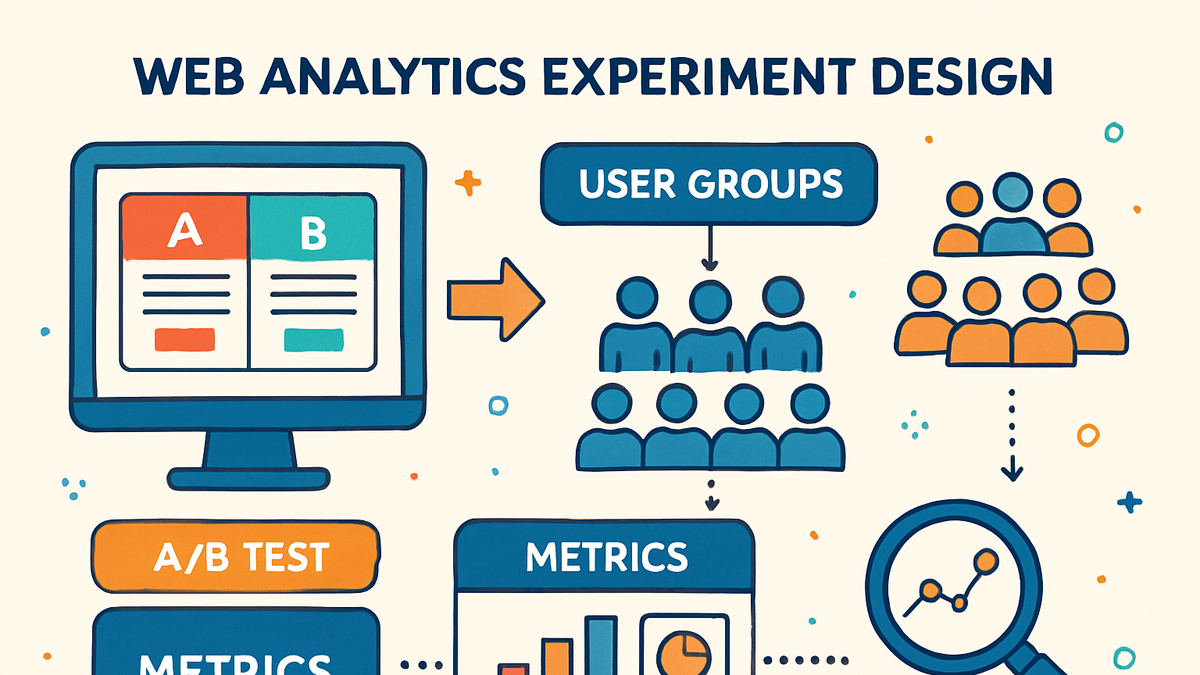
Experiment design
Structured process to plan and analyze analytics experiments, from hypotheses to implementation using PlainSignal and GA4.
Why Experiment Design Matters
Experiment Design ensures that your analytics tests yield reliable, actionable insights. Without rigorous design, you risk drawing false conclusions or wasting resources. Well-structured experiments help you isolate the effect of changes, reduce biases, and increase confidence in results, enabling data-driven decision-making.
-
Valid results
Ensures conclusions reflect true effects rather than random variation.
-
Statistical significance
Probability that observed effects are not due to chance.
-
Confidence intervals
Range within which the true effect size likely falls.
-
-
Risk mitigation
Reduces false positives (Type I error) and false negatives (Type II error), saving time and budget.
-
Type i error
False positive finding an effect when none exists.
-
Type ii error
False negative missing a true effect.
-
-
Data-driven decisions
Provides empirical evidence to guide optimizations and strategy.
-
Iteration
Refining experiments based on previous results.
-
Continuous improvement
Ongoing testing to steadily improve performance.
-
Key Components of Experiment Design
A robust experiment design includes clear hypotheses, defined variables, adequate sample size, and proper randomization to ensure valid, unbiased results.
-
Hypothesis formulation
Articulate a clear, testable statement predicting the effect of a change.
-
Null hypothesis
Baseline assumption of no effect.
-
Alternative hypothesis
Expected effect or difference.
-
-
Variable identification
Determine independent variables (what you change) and dependent variables (what you measure).
-
Independent variables
Elements manipulated in the experiment.
-
Dependent variables
Metrics observed for changes.
-
Control variables
Factors held constant to avoid confounding effects.
-
-
Sample size determination
Calculate how many participants or sessions you need to detect effects with sufficient statistical power.
-
Power analysis
Assess the probability of detecting an effect of a given size.
-
Minimum detectable effect
Smallest effect size worth detecting.
-
-
Randomization & assignment
Randomly assign users to control or test groups to eliminate selection biases.
-
Random assignment
Ensures each user has an equal chance of receiving any variant.
-
Stratification
Maintain balanced segment distribution across variants.
-
Types of Experiments in Analytics
Common frameworks for testing changes in digital analytics include A/B testing, multivariate testing, and split URL testing.
-
A/b testing
Compare two versions of a page or feature (Control vs Variant) to see which performs better.
-
Control group
Users exposed to the original version.
-
Variant group
Users exposed to the modified version.
-
-
Multivariate testing
Test multiple elements simultaneously to understand interaction effects.
-
Factorial designs
All possible combinations of variables are tested.
-
Interaction effects
How changes in one variable may influence another.
-
-
Split url testing
Redirect users to entirely different URLs to compare full-page redesigns.
-
Redirect tests
Use server-side or client-side redirects to route traffic.
-
Implementing Experiments with SaaS Tools
Leverage analytics platforms like PlainSignal and Google Analytics 4 to run and measure experiments with minimal setup.
-
PlainSignal
A cookie-free, lightweight analytics tool ideal for privacy-focused A/B testing. Embed the script:
<link rel="preconnect" href="//eu.plainsignal.com/" crossorigin />
<script defer data-do="yourwebsitedomain.com" data-id="0GQV1xmtzQQ" data-api="//eu.plainsignal.com" src="//cdn.plainsignal.com/plainsignal-min.js"></script>
Then track events:
PlainSignal.event('experiment_view', { experiment_id: 'exp123', variant: 'A' }); -
Google analytics 4
Use GA4’s event-based model to capture experiment data. Configure GA4 in your page header:
<script async src="https://www.googletagmanager.com/gtag/js?id=G-XXXXXXX"></script>
<script>
  window.dataLayer = window.dataLayer || [];
  function gtag(){dataLayer.push(arguments);}
  gtag('js', new Date());
  gtag('config', 'G-XXXXXXX');
</script>
Then send a custom event for variant exposure:
gtag('event', 'experiment_view', {
  experiment_id: 'exp123',
  variant: 'B'
});