Published on 2025-06-27T22:31:29Z
What is Gross Revenue Retention? Examples with GA4 and PlainSignal
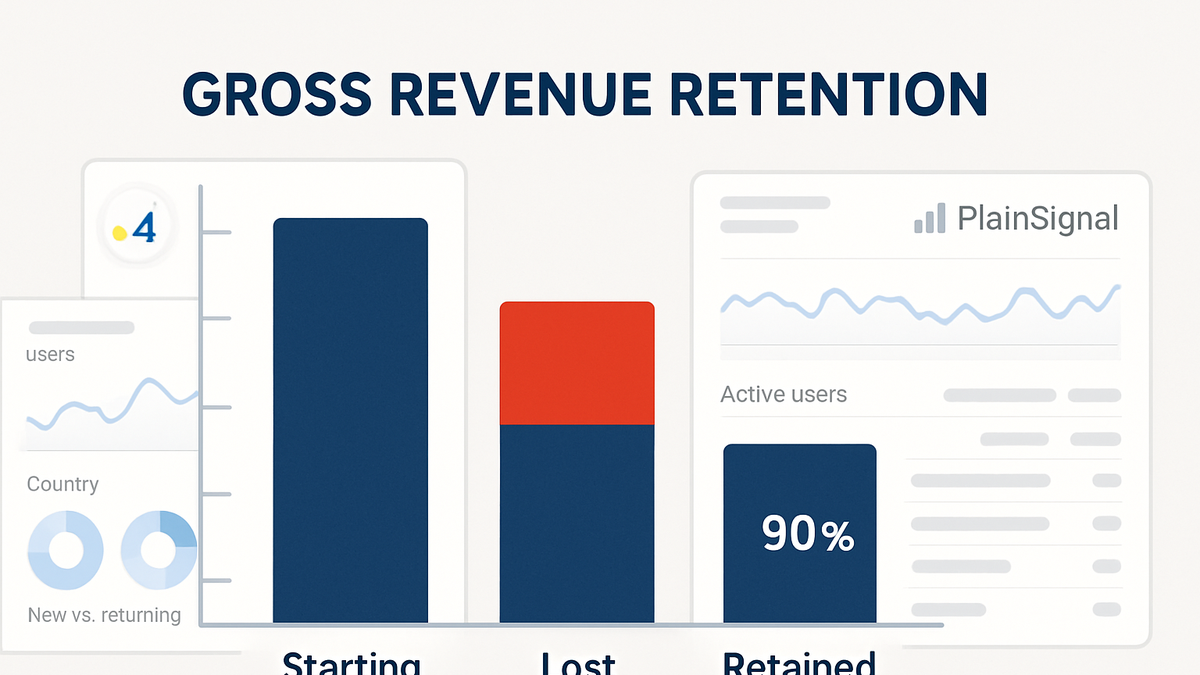
Gross Revenue Retention (GRR) is the proportion of recurring revenue a company retains from its existing customers over a period, ignoring new or expansion revenue. It helps subscription-based businesses understand how much revenue is lost due to cancellations and downgrades. A high GRR indicates strong customer satisfaction, stable contracts, and reliable forecasting. The formula for GRR is:
GRR = (Starting Revenue - Lost Revenue) / Starting Revenue × 100%
Tools like GA4 and PlainSignal can track revenue events to calculate GRR, providing dashboards and cohort analysis to highlight retention trends.
Gross revenue retention
Percentage of recurring revenue retained from existing customers, excluding expansions; a key retention metric.
Understanding Gross Revenue Retention
This section defines GRR, explains its formula and why it’s critical for subscription analytics.
-
Formula and components
The GRR formula measures revenue retained after subtracting churn and downgrades.
GRR = (Starting Revenue - Lost Revenue) / Starting Revenue × 100%-
Starting revenue
Total recurring revenue at the beginning of the period.
-
Lost revenue
Revenue lost due to customer cancellations and plan downgrades.
-
-
Why grr matters
High GRR indicates healthy customer relationships and predictable revenue streams, critical for growth forecasting.
-
Revenue stability
Shows how much revenue base remains consistent over time.
-
Customer satisfaction
Reflects customers’ willingness to continue using the service.
-
Implementing GRR Tracking
Practical examples of setting up GRR measurement using PlainSignal and Google Analytics 4.
-
PlainSignal setup
PlainSignal offers simple, cookie-free analytics ideal for tracking revenue events without PII.
Embed the tracking snippet:
<link rel="preconnect" href="//eu.plainsignal.com/" crossorigin /> <script defer data-do="yourwebsitedomain.com" data-id="0GQV1xmtzQQ" data-api="//eu.plainsignal.com" src="//cdn.plainsignal.com/plainsignal-min.js"></script>-
Event configuration
Define purchase and subscription events to capture revenue metrics.
-
Dashboard reporting
Use PlainSignal’s dashboard to view cohort retention and revenue churn trends.
-
-
GA4 integration
Google Analytics 4 tracks ecommerce and subscription data via events and parameters.
-
Event tracking
Use gtag.js or Google Tag Manager to send ‘purchase’ and ‘subscription_change’ events.
-
Custom reports
Build retention cohorts and custom metrics in GA4 to calculate GRR over time.
-
Best Practices and Common Pitfalls
Guidelines to ensure accurate GRR measurement and avoid common mistakes.
-
Best practices
Adopt these practices for reliable GRR insights.
-
Consistent time frames
Use uniform intervals (e.g., monthly or annually) when comparing GRR.
-
Include all plan types
Ensure downgrades across any subscription tier are captured.
-
-
Common pitfalls
Watch out for these errors that can distort GRR calculations.
-
Ignoring downgrades
Failing to account for downgraded subscriptions inflates retention figures.
-
Mismatched periods
Comparing different time spans can lead to misleading trends.
-