Published on 2025-06-22T08:03:47Z
What is Incremental Lift? Examples and Measurement
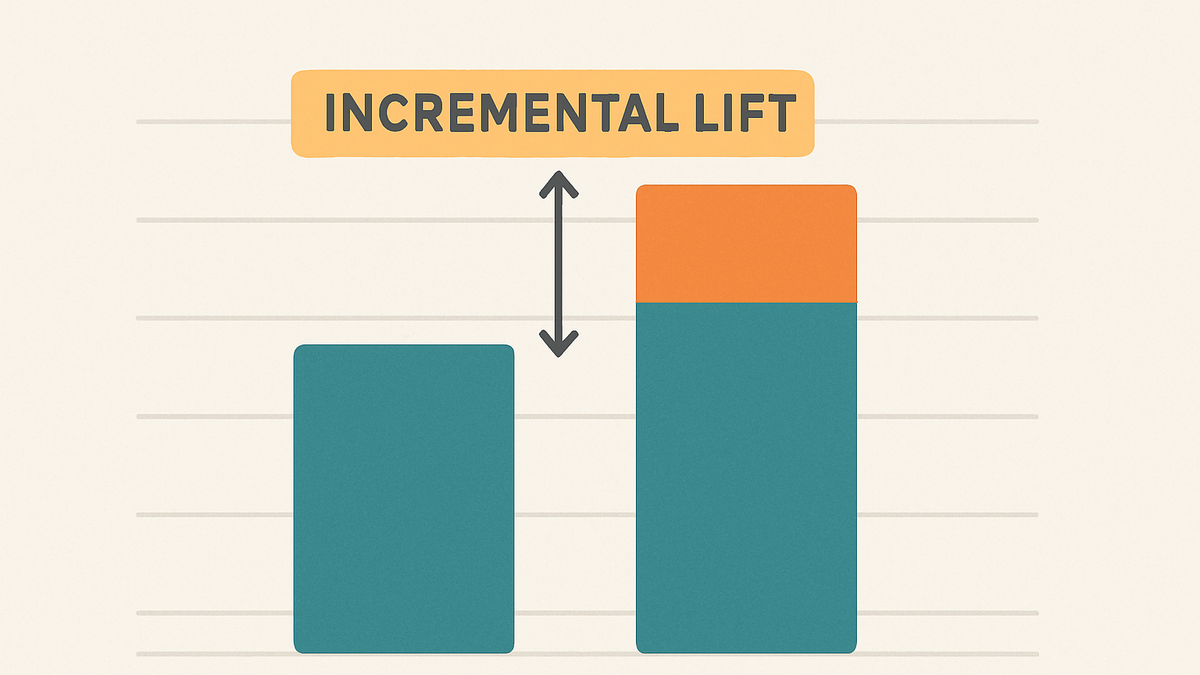
Incremental lift is a powerful metric in analytics that measures the causal impact of a specific action, campaign, or product change. Rather than tracking raw differences in key performance indicators (KPIs), incremental lift isolates the change attributable solely to the treatment by comparing results against a control group. This approach helps marketers and analysts distinguish between general market trends and the true effects of their experiments. By accurately quantifying the additional conversions, revenue, or engagement driven by a campaign, incremental lift enables data-driven decisions for budget allocation and strategy optimization. Modern analytics platforms like Google Analytics 4 (GA4) and PlainSignal facilitate lift measurement through built-in experimentation features, audience segmentation, or holdout tests. With cookie-free analytics gaining traction, PlainSignal offers privacy-compliant lift analysis without relying on user-tracking cookies, ensuring both effectiveness and user privacy.
Incremental lift
Quantifies the true causal impact of a campaign by comparing treatment against a control baseline.
Concept and Definition
Dive into what incremental lift means in the context of analytics.
-
Incremental vs observed lift
Observed lift measures raw changes in metrics, while incremental lift isolates the causal effect by controlling for external factors.
-
Control and treatment groups
Key to calculating incremental lift, these groups ensure a fair comparison between exposed and unexposed audiences.
-
Control group
A subset of users who do not receive the campaign or change, serving as the baseline.
-
Treatment group
The group of users exposed to the campaign, feature, or variation being tested.
-
Calculating Incremental Lift
Understand the formulas and statistical considerations behind lift measurement.
-
Basic lift formula
((Conversion Rate_treatment - Conversion Rate_control) / Conversion Rate_control) × 100
-
Statistical significance
Determine p-values or confidence intervals to ensure the observed lift isn’t due to random chance.
Implementing Lift Analysis in Analytics Tools
Practical steps to measure incremental lift using GA4 and PlainSignal.
-
Google analytics 4 (GA4)
GA4 supports A/B testing and audience comparisons to calculate lift using built-in experimentation.
-
Tracking setup
Use the gtag.js snippet to define and track conversion events.
-
Experiment configuration
Create an A/B test in the GA4 Experiments module and assign traffic splits.
-
Data analysis
Compare conversion rates across variants in the Experiments report to compute lift.
-
-
PlainSignal (cookie-free analytics)
PlainSignal enables privacy-compliant lift measurement without relying on cookies or personal identifiers.
-
Integration code
Install the PlainSignal snippet on your site:
<link rel="preconnect" href="//eu.plainsignal.com/" crossorigin /> <script defer data-do="yourwebsitedomain.com" data-id="0GQV1xmtzQQ" data-api="//eu.plainsignal.com" src="//cdn.plainsignal.com/plainsignal-min.js"></script> -
Defining holdouts
Configure audience holdouts or experiment flags to create control and treatment segments in PlainSignal.
-
Best Practices and Common Pitfalls
Tips to ensure accurate lift measurement and avoid errors.
-
Randomization
Ensure truly random assignment to control and treatment to avoid selection bias.
-
Adequate sample size
Collect enough observations to achieve statistical power and reliable results.
-
Accounting for external factors
Control for seasonality, market trends, and external events that may skew results.