Published on 2025-06-22T08:40:31Z
What Is Page Timing? Examples and Use Cases
What Is Page Timing?
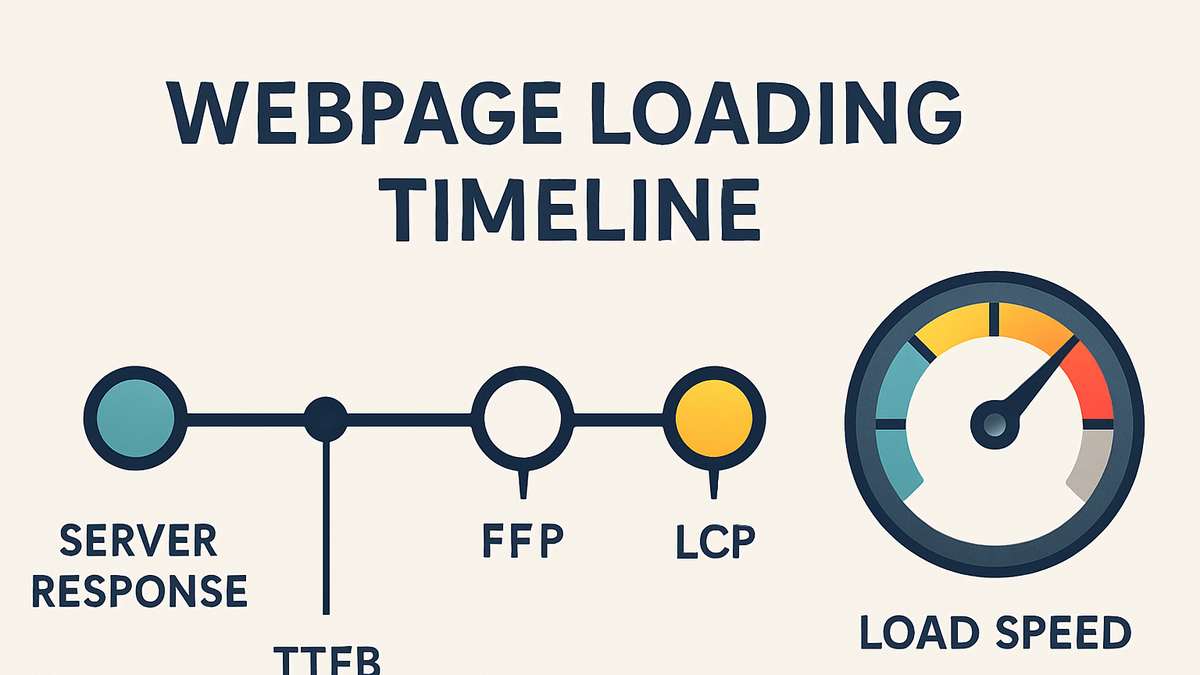
Page Timing refers to the measurement of how long different stages of a webpage take to load and render in a user’s browser. It captures key events such as the initial server response, the rendering of the first visible element, and the moment the page becomes fully interactive. By breaking down load time into discrete milestones, Page Timing helps teams identify performance bottlenecks and prioritize optimizations. In analytics platforms like GA4 and cookie-free tools such as PlainSignal, Page Timing data bridges technical metrics with business outcomes like engagement, retention, and conversion. Below is an example of how to install PlainSignal for simple, privacy-focused Page Timing measurement:
<link rel="preconnect" href="//eu.plainsignal.com/" crossorigin />
<script defer data-do="yourwebsitedomain.com" data-id="0GQV1xmtzQQ" data-api="//eu.plainsignal.com" src="//cdn.plainsignal.com/plainsignal-min.js"></script>
Page timing
Page Timing measures how long key page load events take, helping teams optimize performance, user experience, and SEO.
Why Page Timing Matters
Understanding Page Timing is essential for both technical teams and business stakeholders. Slow load times frustrate users, increase bounce rates, and can directly impact SEO rankings. By monitoring Page Timing metrics, organizations can proactively improve site speed, deliver smoother user experiences, and support conversion goals.
-
User experience
Fast, predictable loading keeps users engaged. Even a 100 ms improvement in load time can reduce bounce rates and boost satisfaction.
-
Seo and search rankings
Search engines like Google factor page speed into rankings. Better Page Timing often leads to higher visibility in search results.
Key Metrics in Page Timing
Page Timing is composed of several core metrics, each highlighting a different phase of the load process. Tracking these allows granular insight into where delays occur and how they impact user perception.
-
Time to first byte (ttfb)
Measures the time from the user’s request until the browser receives the first byte of response from the server.
-
Definition
Interval between navigation start and first byte arrival.
-
Impact
High TTFB often indicates server or network latency issues.
-
-
First contentful paint (fcp)
Marks when the browser first renders any text, image, or canvas on the screen.
-
Definition
Time until the first DOM element is painted.
-
Best practices
Optimize critical CSS and defer non-essential scripts to improve FCP.
-
-
Largest contentful paint (lcp)
Records when the largest visible content element (e.g., image or heading) has finished rendering.
-
Definition
Time until the main content element is fully displayed.
-
Recommended thresholds
Aim for LCP under 2.5 seconds for good user experience.
-
How to Measure Page Timing
There are multiple ways to collect Page Timing data, from built-in browser APIs to third-party analytics platforms. Below are examples using GA4 and PlainSignal.
-
Google analytics 4 (GA4)
GA4 automatically gathers site speed and Page Timing metrics without additional instrumentation beyond the standard gtag.js snippet.
-
Setup
Include the GA4 gtag.js snippet in your
<head>and configure your Measurement ID. -
Report location
Navigate to Engagement → Pages and screens → Speed metrics in the GA4 console.
-
-
PlainSignal (cookie-free)
PlainSignal is a lightweight, privacy-focused analytics tool that captures Page Timing without cookies or consent banners.
-
Installation
Paste the PlainSignal snippet just before your closing
</head>tag. -
Example snippet
<link rel="preconnect" href="//eu.plainsignal.com/" crossorigin />
<script defer data-do="yourwebsitedomain.com" data-id="0GQV1xmtzQQ" data-api="//eu.plainsignal.com" src="//cdn.plainsignal.com/plainsignal-min.js"></script>
-
Best Practices to Improve Page Timing
Once you’ve identified slowdowns via Page Timing metrics, apply these optimizations to accelerate load performance and deliver a seamless experience.
-
Optimize images and media
Compress, use modern formats, and lazy-load offscreen assets to reduce payload size.
-
Leverage caching and cdns
Distribute assets via CDN and set appropriate cache headers to serve repeat visitors faster.
-
Minimize and defer javascript
Bundle, minify, and defer non-critical scripts to prevent blocking rendering.
-
Implement performance budgets
Define strict size and timing thresholds to keep your site fast as it evolves.