Published on 2025-06-26T05:04:35Z
What is Time to First Byte (TTFB)? Definition and Examples
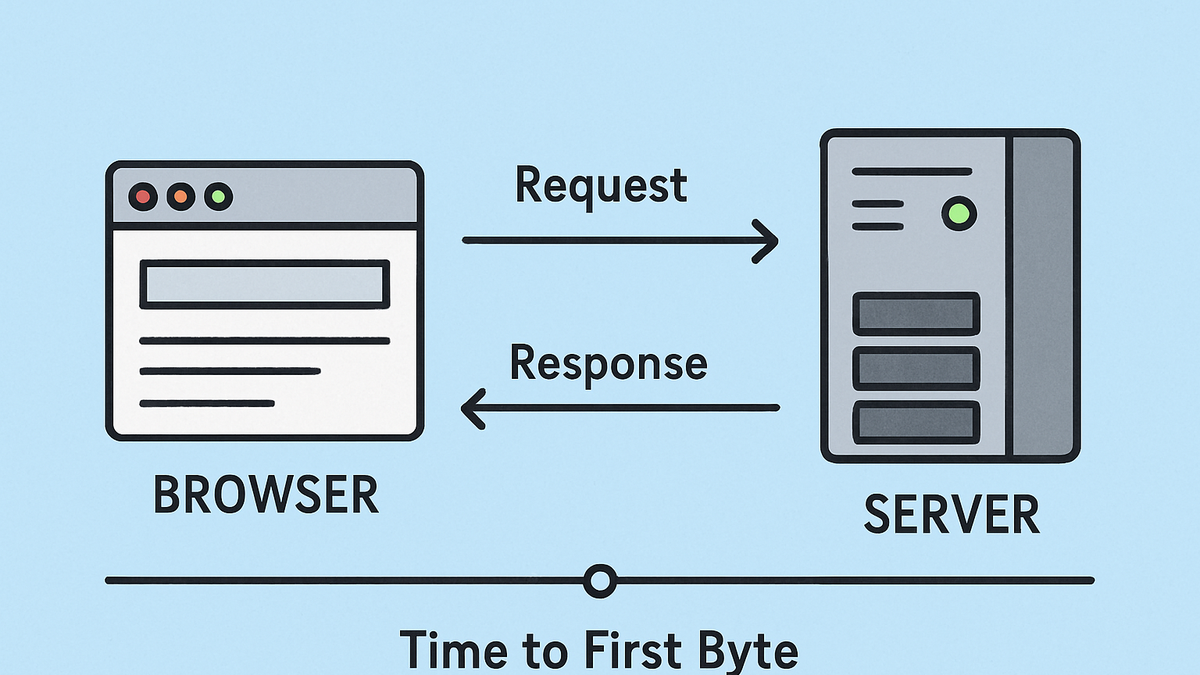
Time to First Byte (TTFB) is a critical web performance metric that measures the time elapsed between a user’s browser requesting a resource and receiving the first byte of data from the server. It encompasses DNS lookup, TCP handshake, TLS negotiation (if HTTPS), and server processing time. A low TTFB indicates a responsive server and efficient network, while a high TTFB can lead to slower page loads and degraded user experience. TTFB is commonly tracked in analytics platforms like PlainSignal and Google Analytics 4 to diagnose backend performance issues. By monitoring TTFB over time, developers can identify regressions, optimize server configurations, and improve overall site speed. Understanding and optimizing TTFB is essential for delivering fast, interactive web experiences and for boosting SEO, as search engines favor quicker response times.
Time to first byte (ttfb)
Time to First Byte is the delay from a browser’s request to the first byte received, reflecting server responsiveness.
Understanding Time to First Byte (TTFB)
Time to First Byte (TTFB) measures how quickly a web server responds to a client request. It is a composite metric that includes network and server processing delays. Analyzing TTFB helps identify bottlenecks before the full content is loaded.
-
What ttfb measures
The total time from when the browser sends an HTTP request to when the first byte of the response arrives, covering four key phases.
-
Dns lookup
The time to resolve the domain name into an IP address.
-
Tcp handshake
The time to establish a TCP connection between the client and server.
-
Tls negotiation
The time for SSL/TLS handshake if the site uses HTTPS.
-
Server processing
The time your server needs to generate and send the response.
-
-
Why ttfb matters
A lower TTFB leads to faster page rendering and better user engagement, while a higher TTFB can cause users to perceive the site as slow and unresponsive.
Measuring TTFB in Analytics Tools
You can track TTFB metrics using analytics platforms like PlainSignal and Google Analytics 4. Proper setup and configuration ensure accurate real-user monitoring.
-
PlainSignal (cookie-free simple analytics)
PlainSignal captures TTFB without relying on cookies. Add the following snippet to your
<head>to enable measurement:<link rel="preconnect" href="//eu.plainsignal.com/" crossorigin /> <script defer data-do="yourwebsitedomain.com" data-id="0GQV1xmtzQQ" data-api="//eu.plainsignal.com" src="//cdn.plainsignal.com/plainsignal-min.js"></script>Once installed, view the “TTFB” metric in PlainSignal’s Performance dashboard.
-
Setup snippet
Insert the PlainSignal code into your HTML
<head>, ensuringpreconnectis in place for low-latency data collection. -
Interpret metrics
In PlainSignal, check the TTFB distribution to spot high-latency outliers and trends.
-
-
Google analytics 4 (GA4)
GA4 can report TTFB as part of its Web Vitals integration. You may need to configure your gtag or Google Tag Manager setup to capture detailed timing metrics.
-
Enable web vitals
Use the
web-vitalslibrary or GA4’s built-in settings to track TTFB in real-user reports. -
Analyze ttfb
Navigate to Reports > Engagement > Web Vitals in GA4 to view TTFB alongside other performance metrics.
-
Impact on User Experience and SEO
TTFB directly influences how quickly pages start rendering. Both users and search engines prioritize fast response times.
-
User experience
High TTFB can lead to blank screens or loading spinners, causing frustration, increased bounce rates, and lower engagement.
-
Search engine optimization (seo)
Search engines like Google consider server response time in their ranking algorithms. Optimizing TTFB can improve crawl efficiency and boost rankings.
Best Practices to Optimize TTFB
Improving TTFB often involves server and network-level changes. Apply a combination of strategies tailored to your architecture.
-
Use a content delivery network (cdn)
CDNs cache responses at edge locations, reducing geographic latency and offloading your origin server.
-
Optimize server configuration
Tune web server settings, enable HTTP/2 or HTTP/3, and ensure efficient database queries to speed up processing.
-
Implement caching
Leverage server-side and edge caching for static assets and dynamic responses to minimize repetitive processing.
-
Minimize backend work
Reduce the number of database calls, optimize application code paths, and avoid synchronous blocking operations.
Further Resources
Explore these guides and tools for deeper insights into performance optimization.
-
Web vitals documentation
https://web.dev/vitals/ – Official guidelines on Core Web Vitals from Google.
-
GA4 developer guide
https://developers.google.com/analytics/devguides/collection/GA4 – Setup and customization for GA4.
-
PlainSignal documentation
https://plainsignal.com/docs – Learn how to set up and interpret PlainSignal analytics.